Axebow’s dashboard presents a consistent and intuitive interface that allows users to easily interact with the platform and understand the state of the loads the platform handles for them.
In what follows we describe how the web interface is organized and how to achieve the main functions it provides to its users. The goal is to facilitate the progressive learning of the platform for new users.
The documentation follows a step-by-step approach, aligned with the real user experience, from the initial onboarding to the complete creation of an infrastructure and the deployment and monitoring of services.
1 User Registration
All users must authenticate to acces Axebow’s web interface.
Users must use one of the OpenID providers supported by the platform, presented in the initial menu:
From there, users are taken to registration and user acceptance forms. After the user accepts the terms of service they are taken to the home dashboard.
2 General aspects
Through all pages, the main interface shows a sidebar giving quick access to managing the main elements of the platform (Tenants, Accounts, Environments, Deployed services, Marketplace)
Also, on every page, the header provides access to que Quick actions menu on the left, and presents notifications and access to user-centric info and actions on the right.

Finally, at the bottom of each page there are several links that let users read the policy, terms of use and other information. Click on the corresponding link to read the desired information.

3 Home dashboard
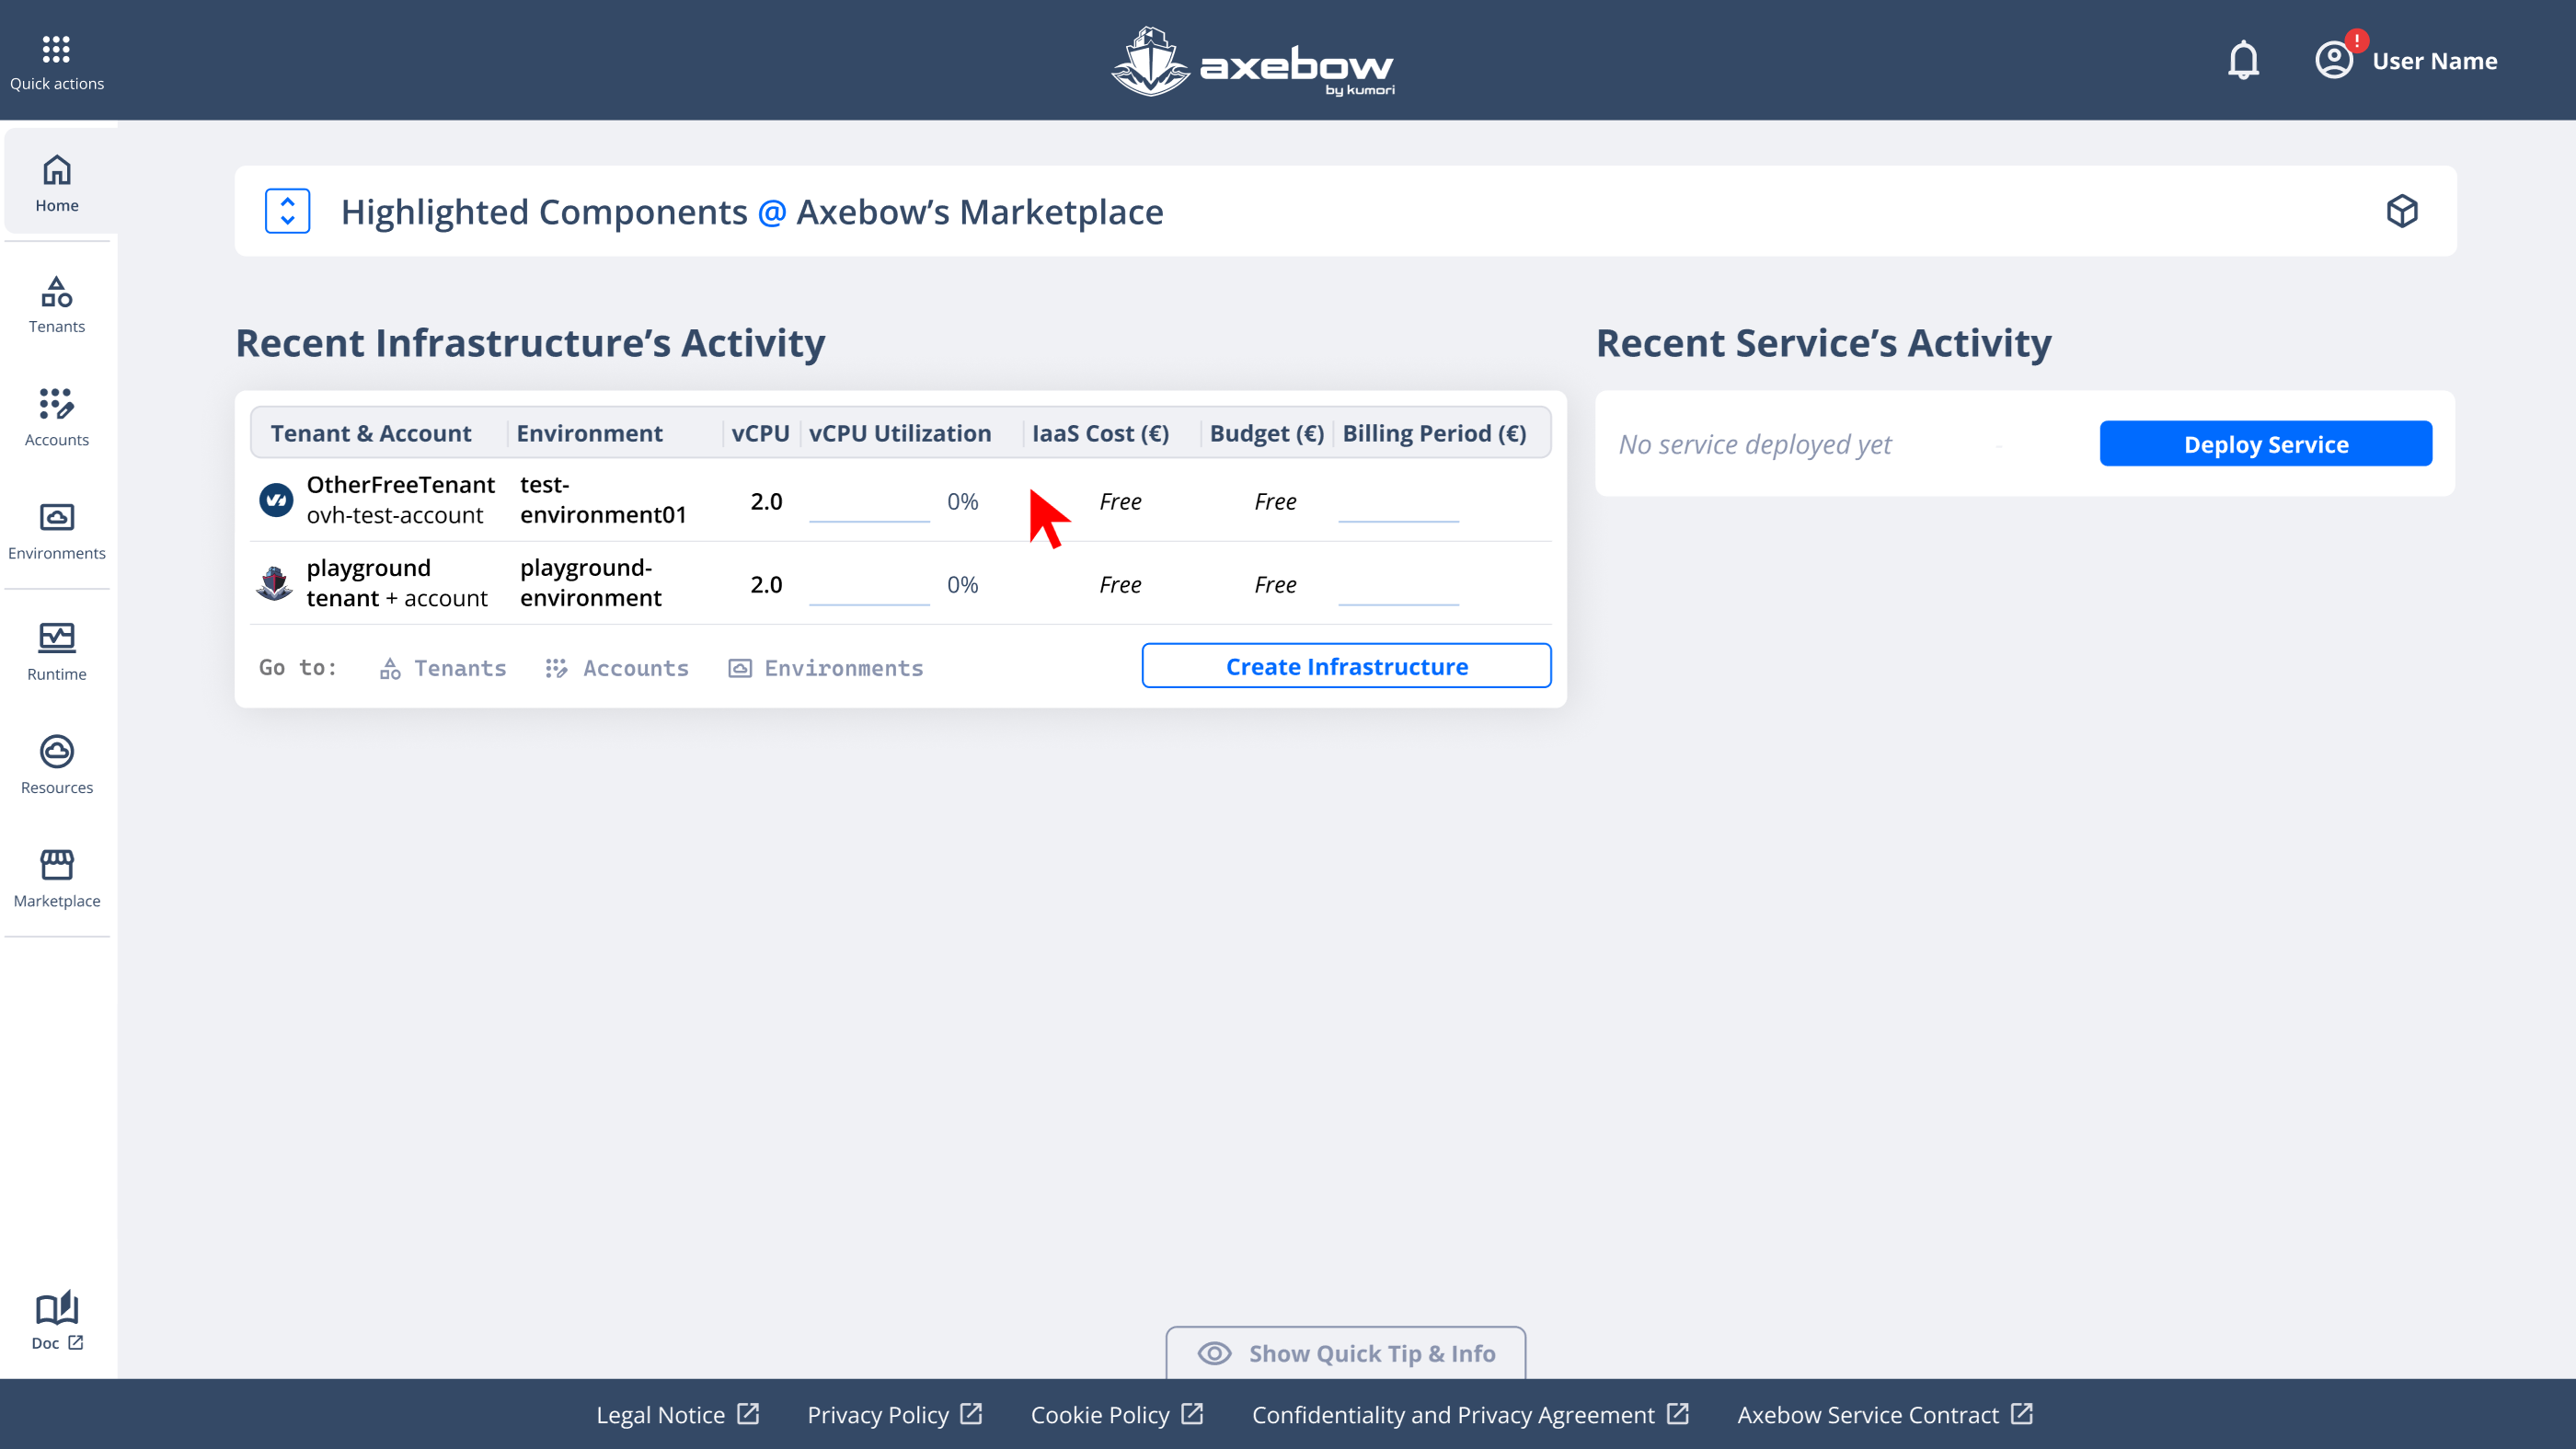
After completing registration on the platform, the user is presented with the home dashboard, which will show just the playground and the quick tips access.
![]()
When infrastructure is present, however we have two breakpoints on the page.
In the first page breakpoint, a summary is displayed showing:
- recent infrastructure activities
- recently deployed services
There is also an onboarding section, collapsed into the “Show Quick Tip & Info” block, prioritizing relevant operational information.
Initially users are given access to the playground, thus its information is shown in the page.
Next we show an example for a user with many deployed infrastructures and services.
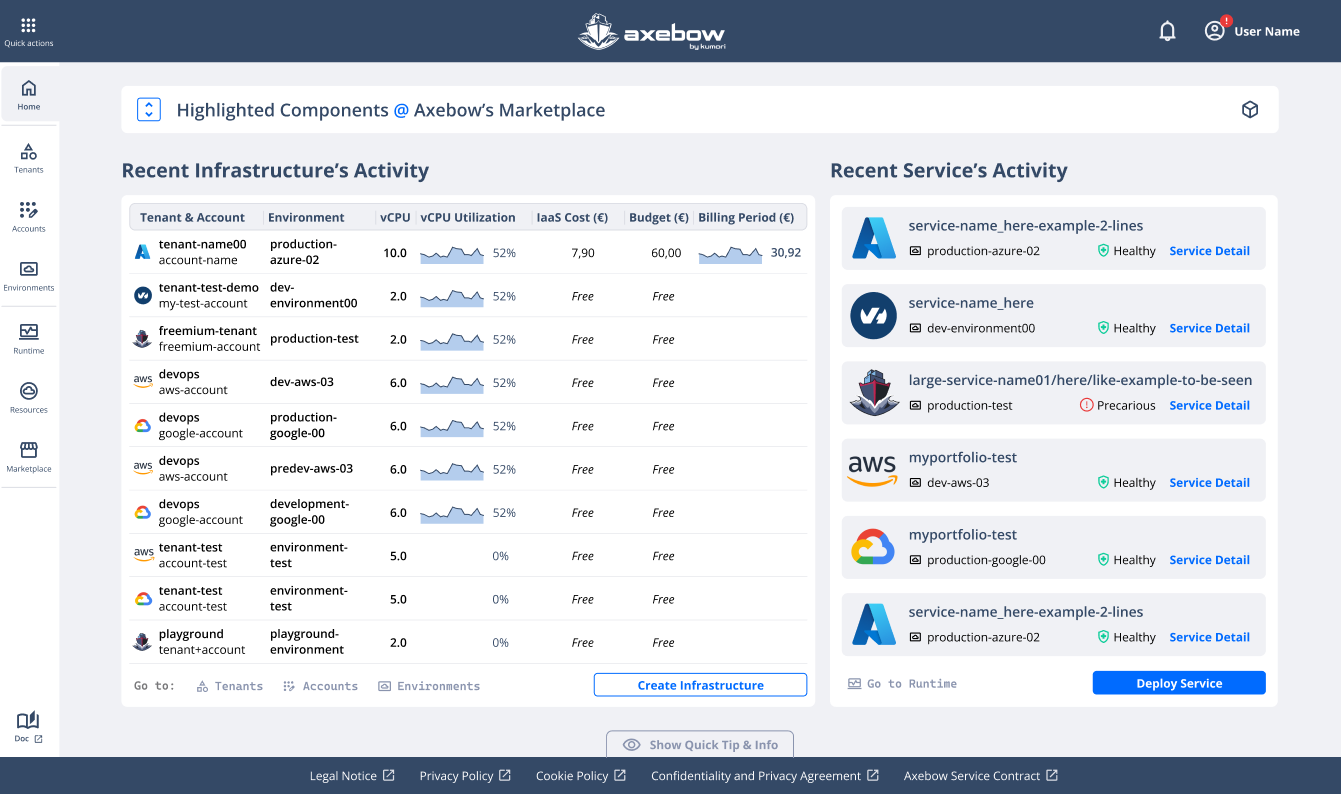
The “Quick tips” section can be expanded giving the user access to an introductory explanation summary of the platformand a set of help guides on the left, that can work as the starting point of the onboarding process/
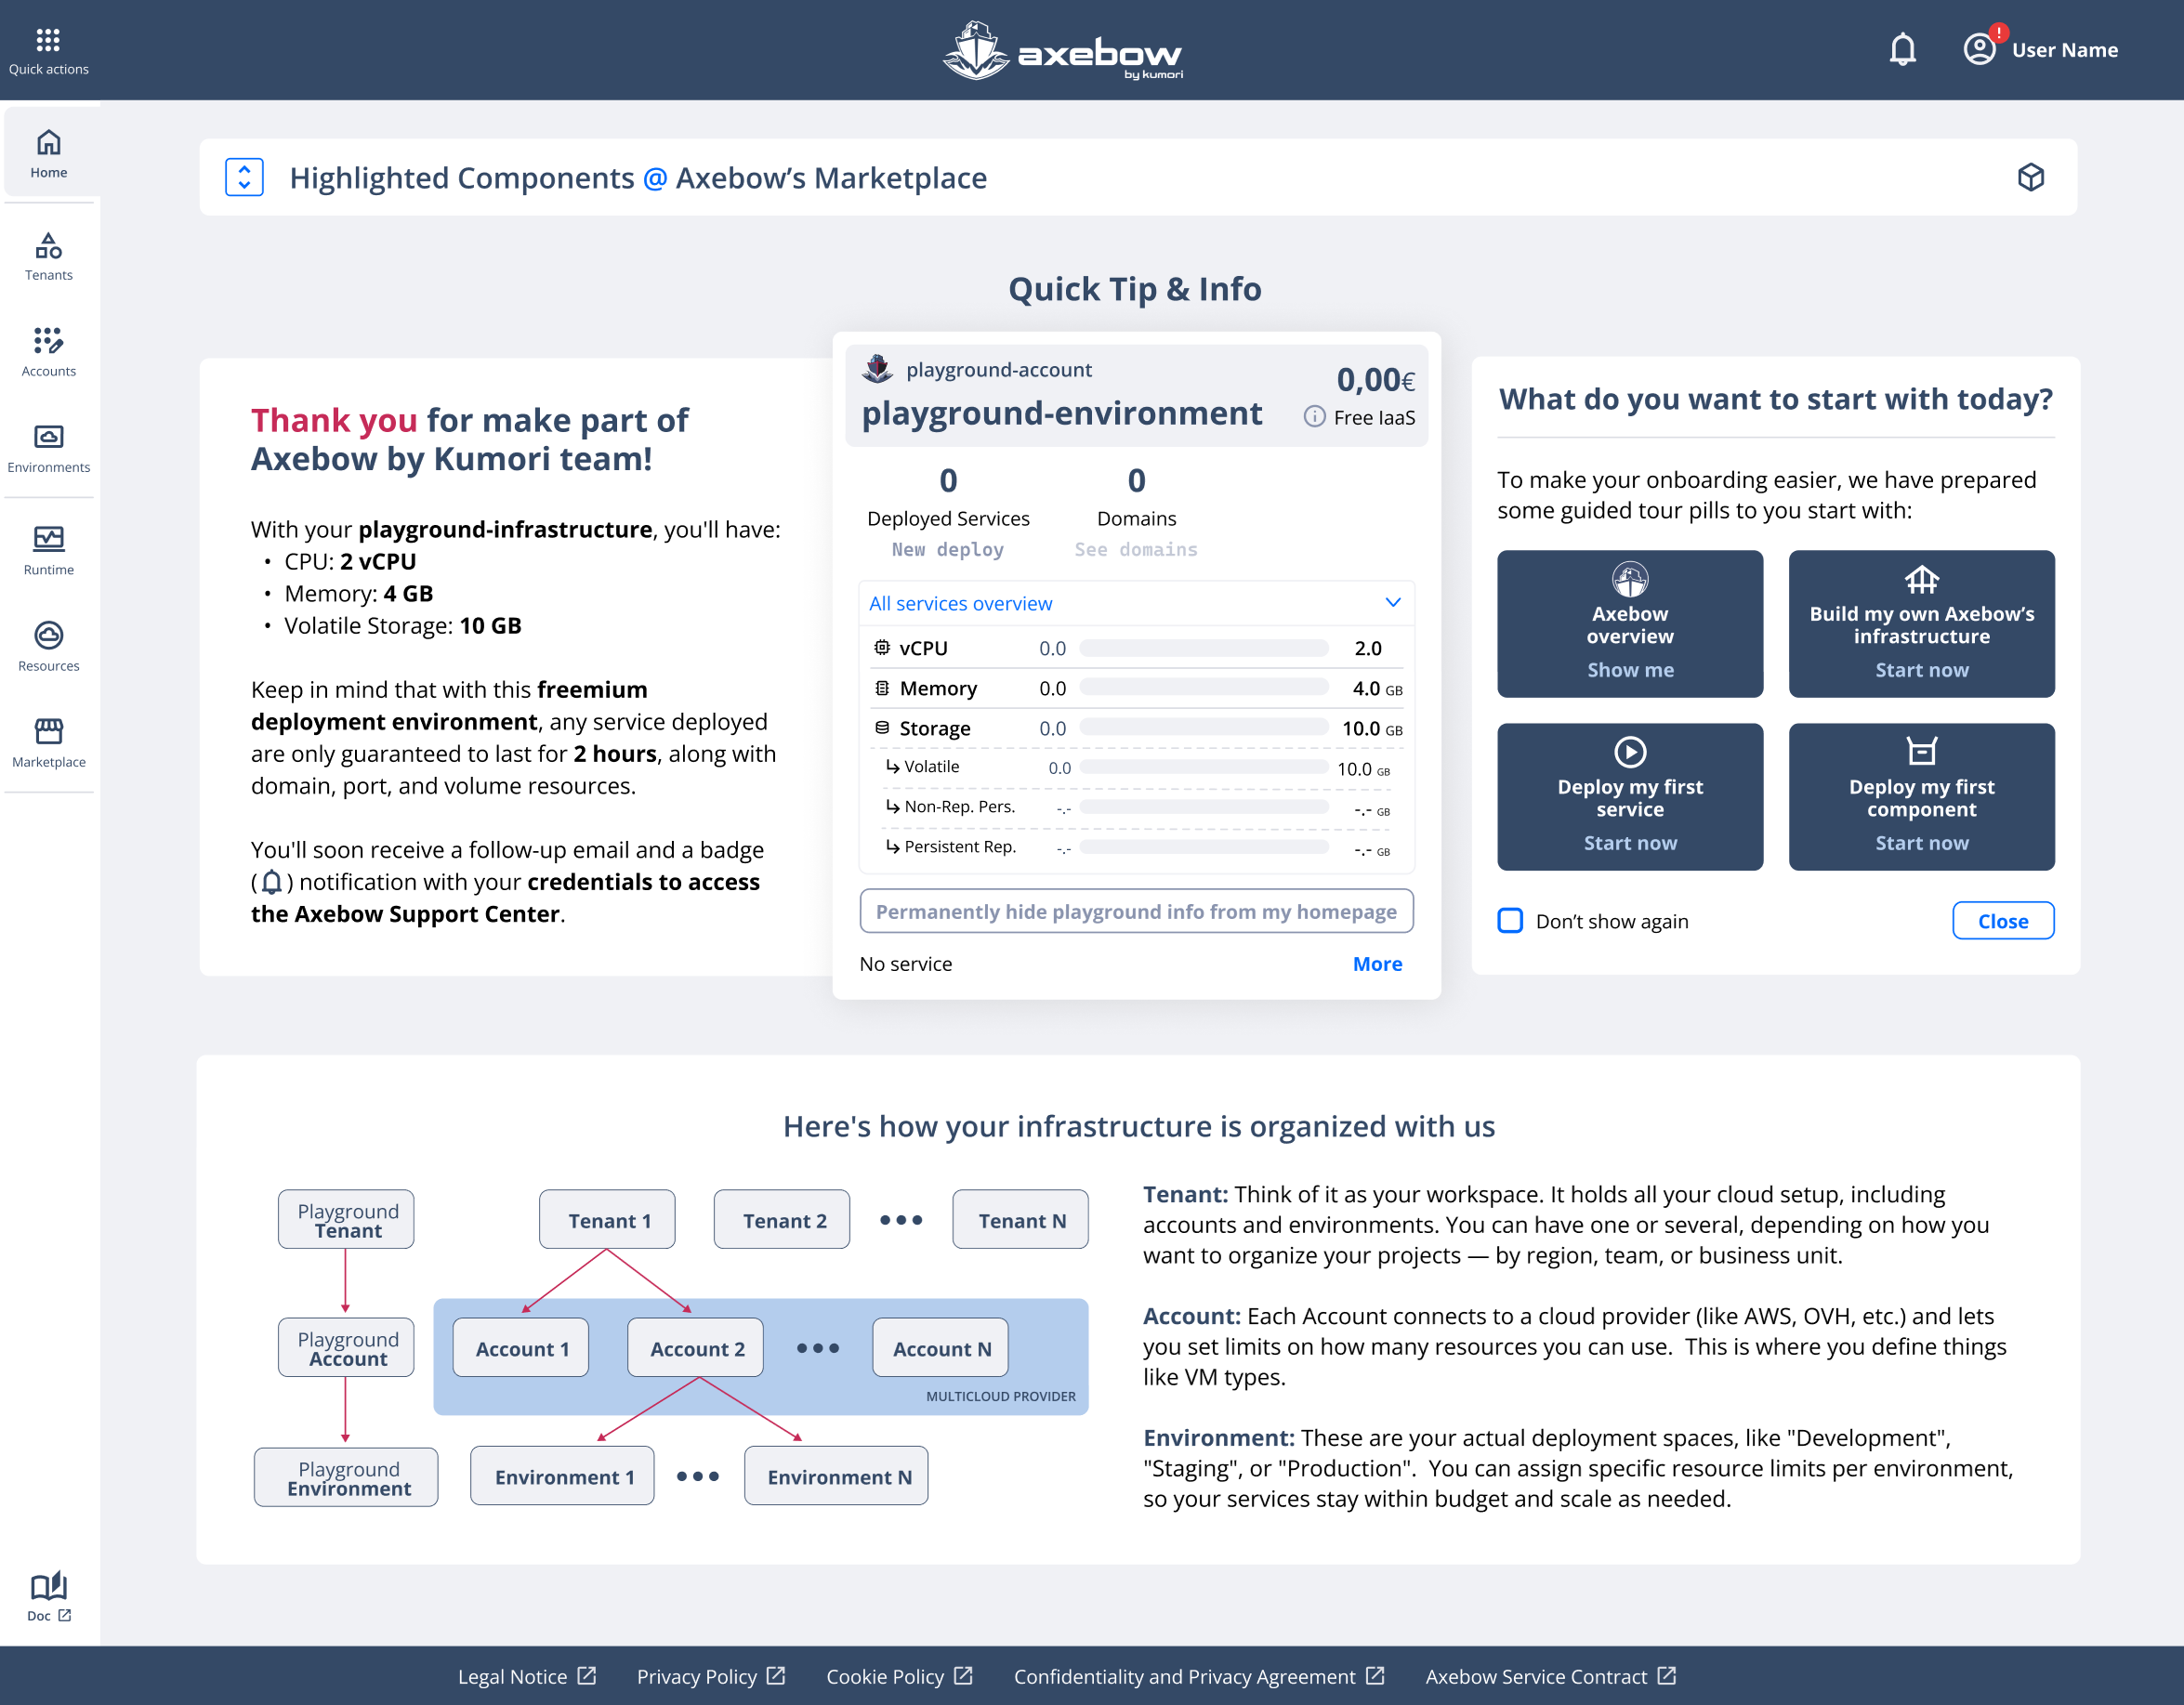
Available links:
- Axebow overview
- This link takes the user to the general documentation page of the Axebow platform (the one currently being consulted), where they can understand the key concepts, structure, and main functionalities of the WUI.
- Build my own Axebow infrastructure
- This link starts the flow for creating the basic infrastructure required to deploy services in Axebow. The flow begins with the creation of a Tenant (the first organizational unit of the infrastructure).
- Deploy my first service
- This link takes the user directly to the beginning of the microservice deployment flow.
If the user has not yet created their own infrastructure (Tenant + Account + Environment), they can still deploy a service using Axebow’s test infrastructure called Playground, which acts as a sandbox environment for exploration and learning.
- Deploy my first component
- This option takes the user to the Marketplace dashboard, where they can choose between services and microservices (apps and components, respectively) to start the deployment flow.
The microservice deployment flow is the same as Deploy Service, with the exception that certain parameters and configurations are pre-defined and mandatory to ensure the correct operation of the component.
The user can skip the onboarding proposed. When they later revisit Axebow’s Home page after navigating the platform, they can find this onboarding section embedded within the page body, as shown below in the section “What do you want to start with today?”:
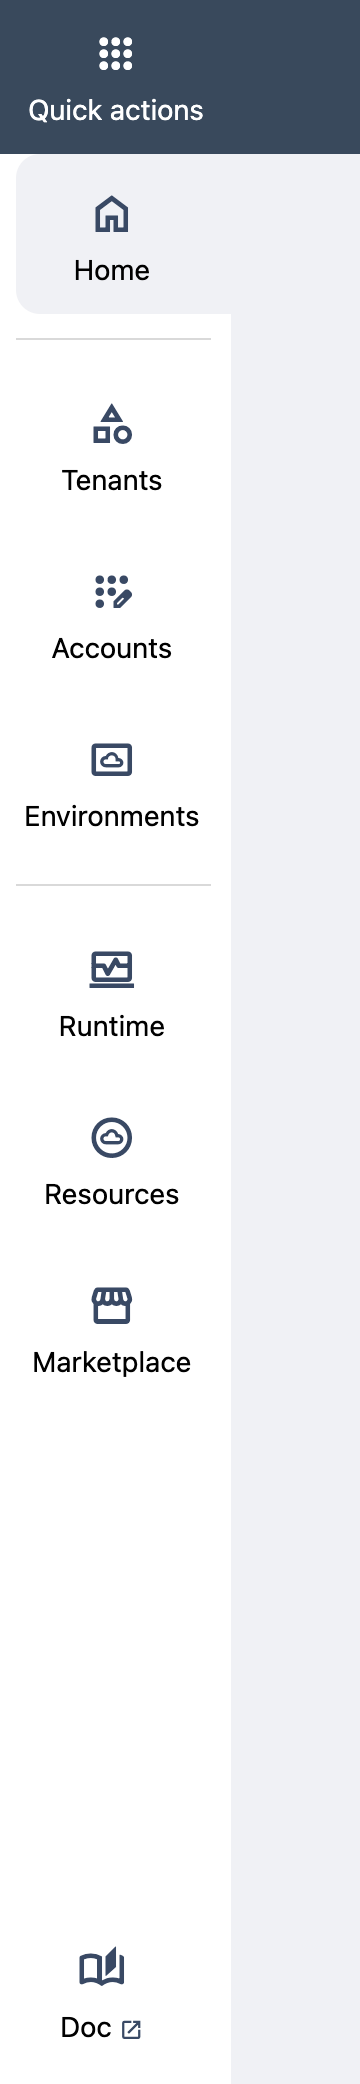
3.1 Quick Actions Menu
The “Quick Actions” button, located at the top of the left-side navigation, groups the main actions available to the user.
This menu is designed to adapt to the user’s level of learning and maturity within the platform. In other words, the available options evolve based on the actions the user has already completed.
For example:
If the user has just registered and has not yet created infrastructure or deployed services, the menu will guide them to create their first Tenant or deploy their first service in the Playground.
As the user progresses (creates infrastructure, deploys services), the menu progressively expands the available actions.
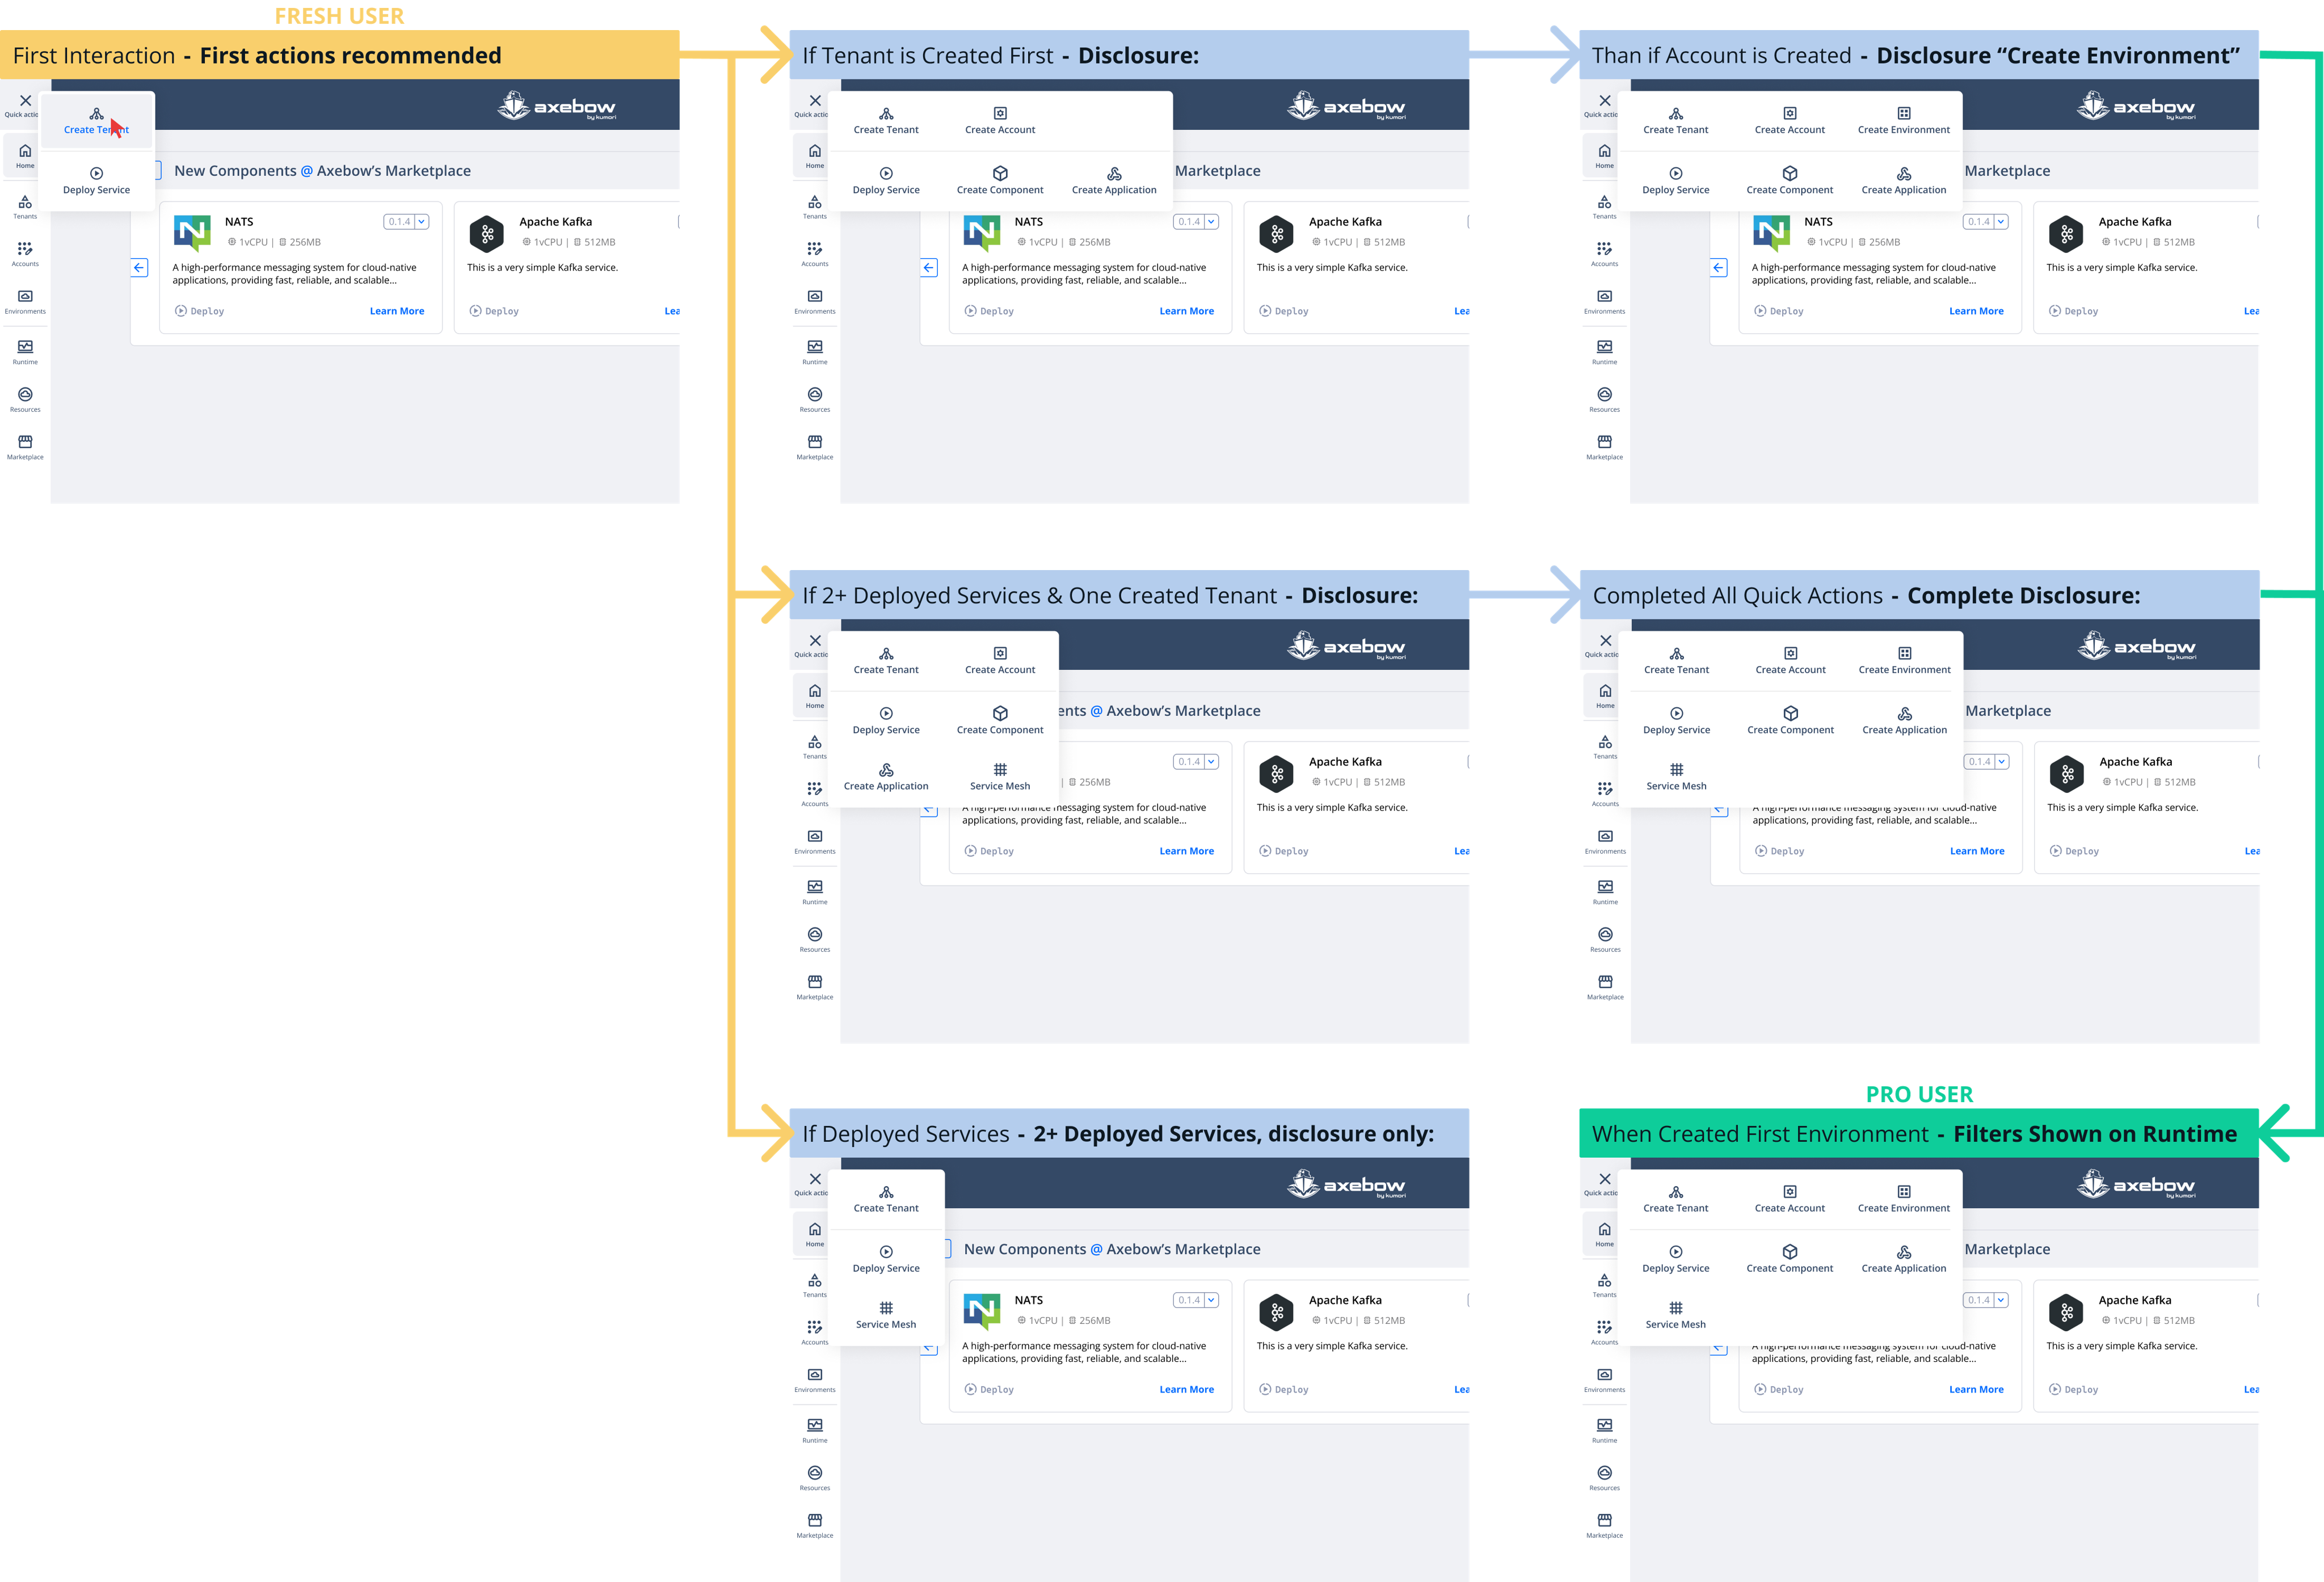
The goal is to offer a progressive discovery experience, suitable for both new and advanced users, where actions are revealed based on context and user engagement level
4 Managing Infrastructure
Managing infrastructure on Axebow entails creating tenants, accounts and environments. We cover how to go about those tasks in what follows.
A user can create many tenants. Users can manage their tenants selecting the Tenant option from the sidebar, giving users access to all functions related to tenant management.
To quickly create a tenant, users can go through the Quick Actions menu, however.
4.1 Creating a tenant
To create a Tenant, the user must:
- Assign a name to the Tenant
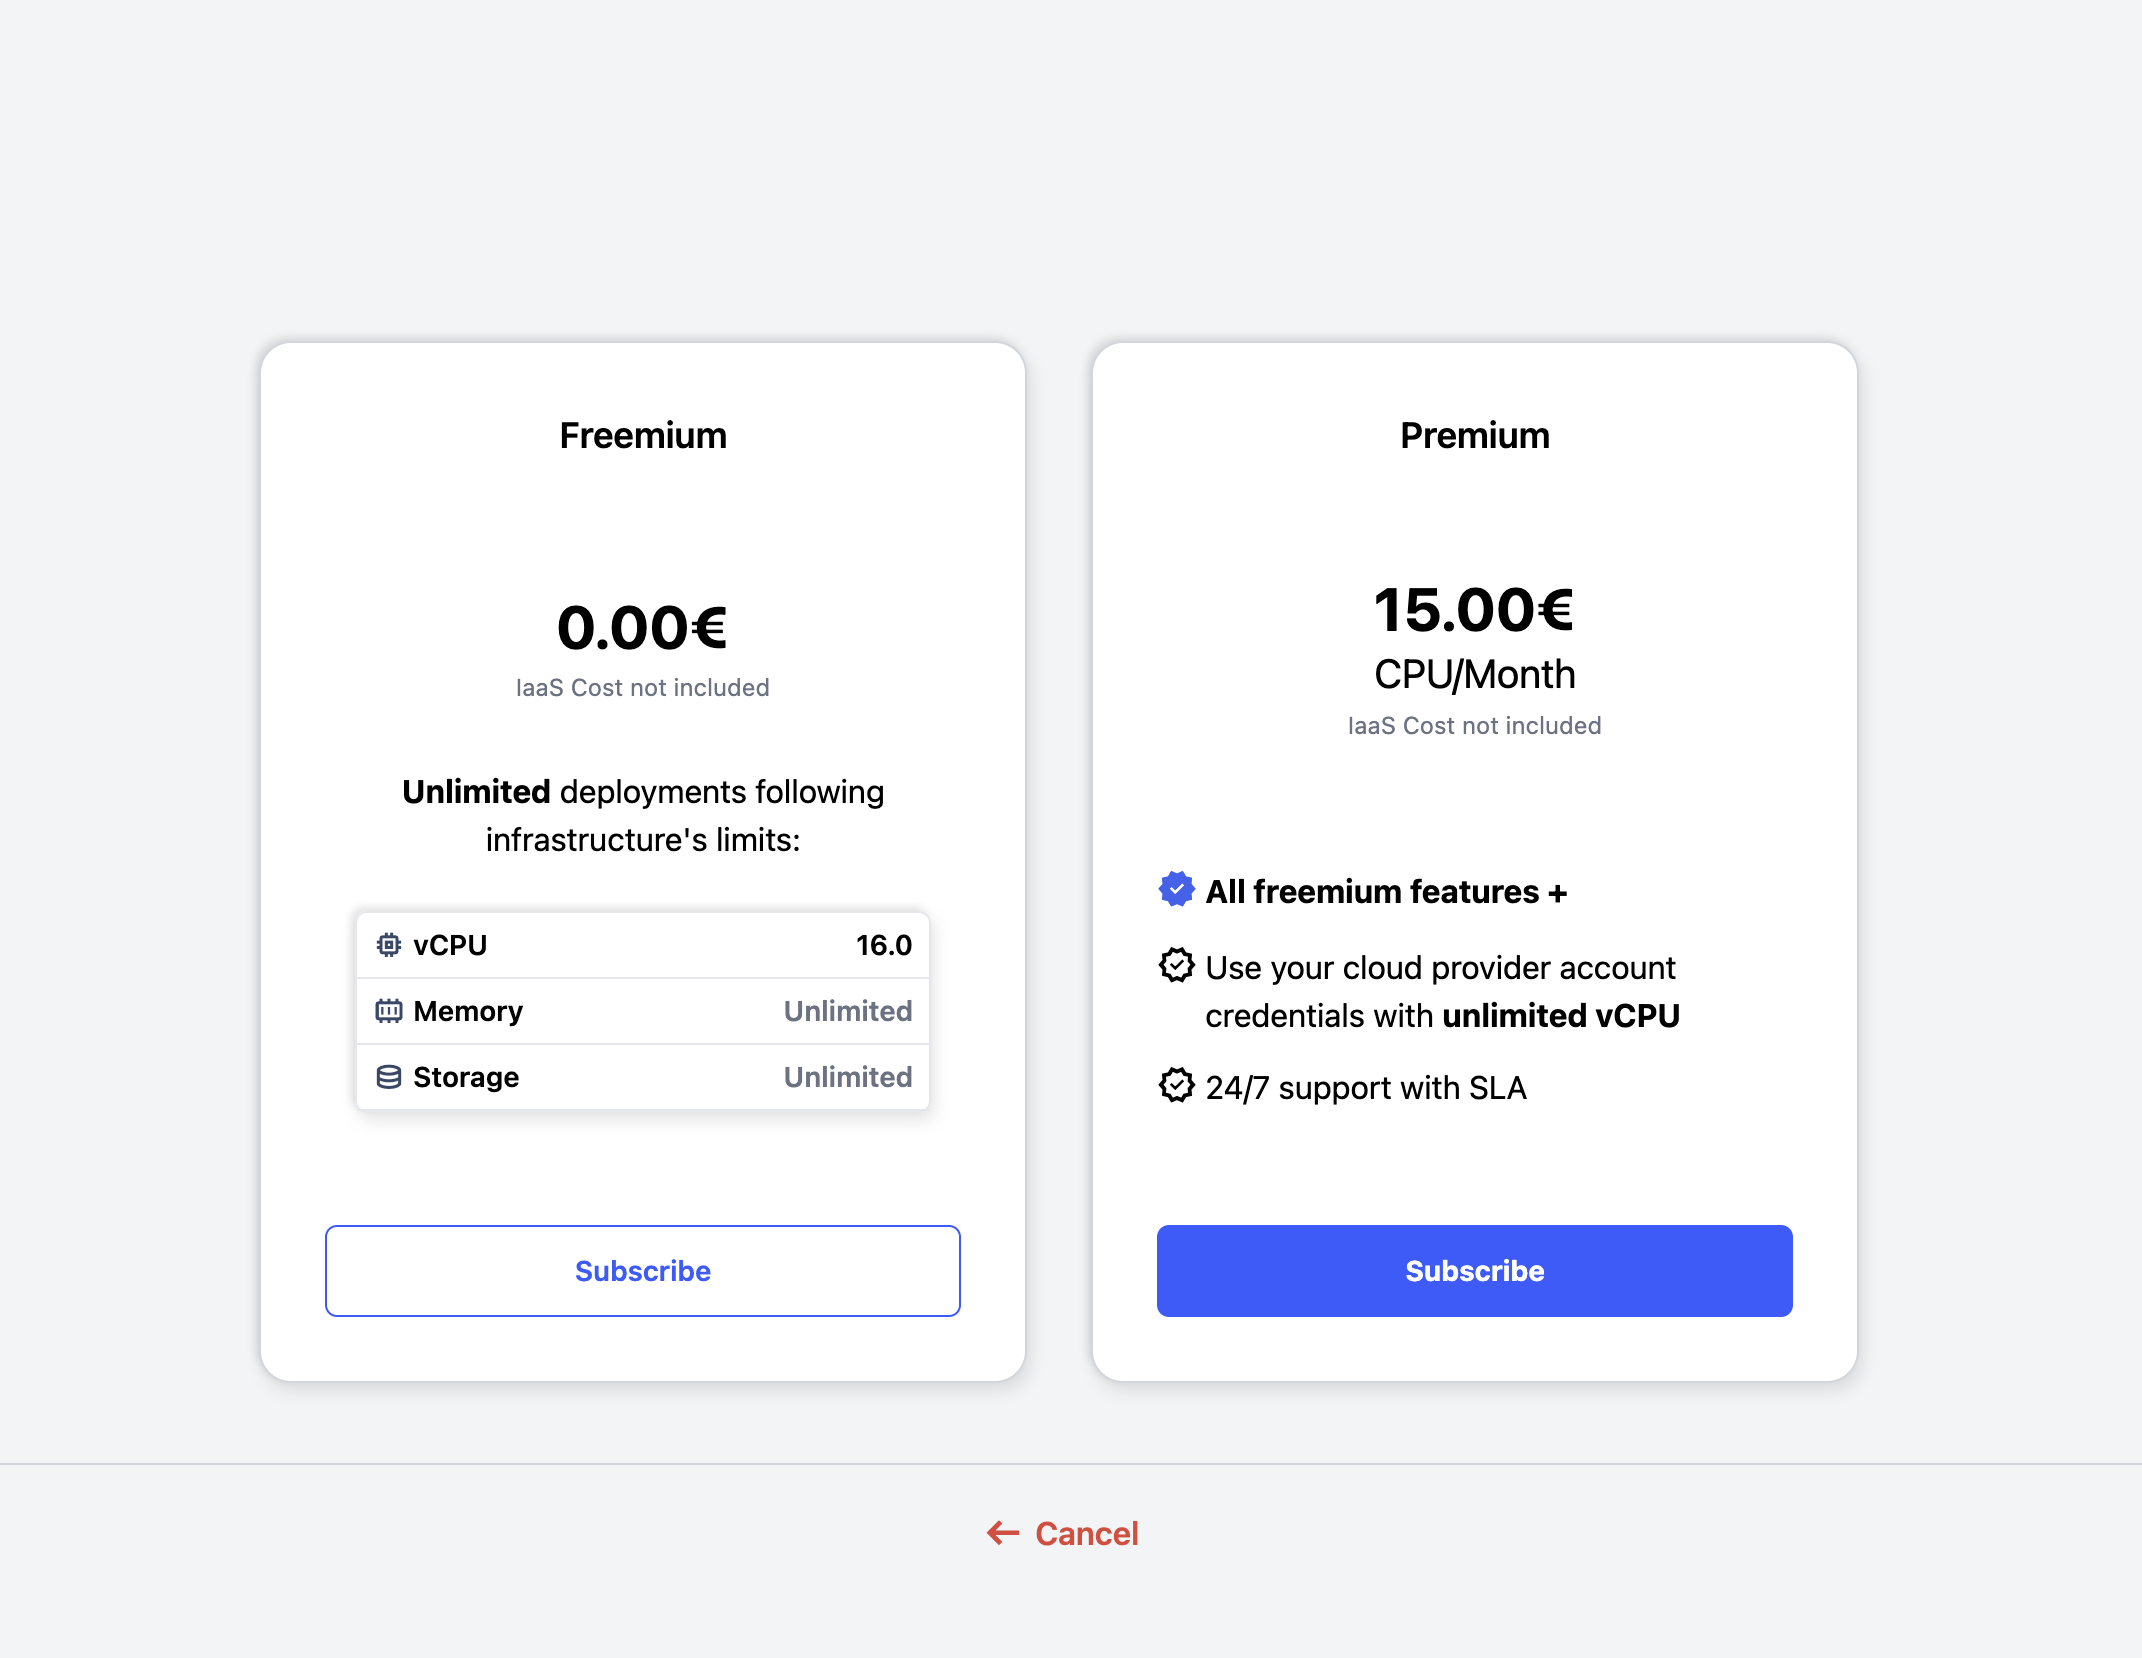
- Select a subscription plan, as every tenants must be assigned a subscription plan on the platform.
In addition, the user can also configure a private artifact registry, so that all tenant’s users can share service definitions.tenant-creato
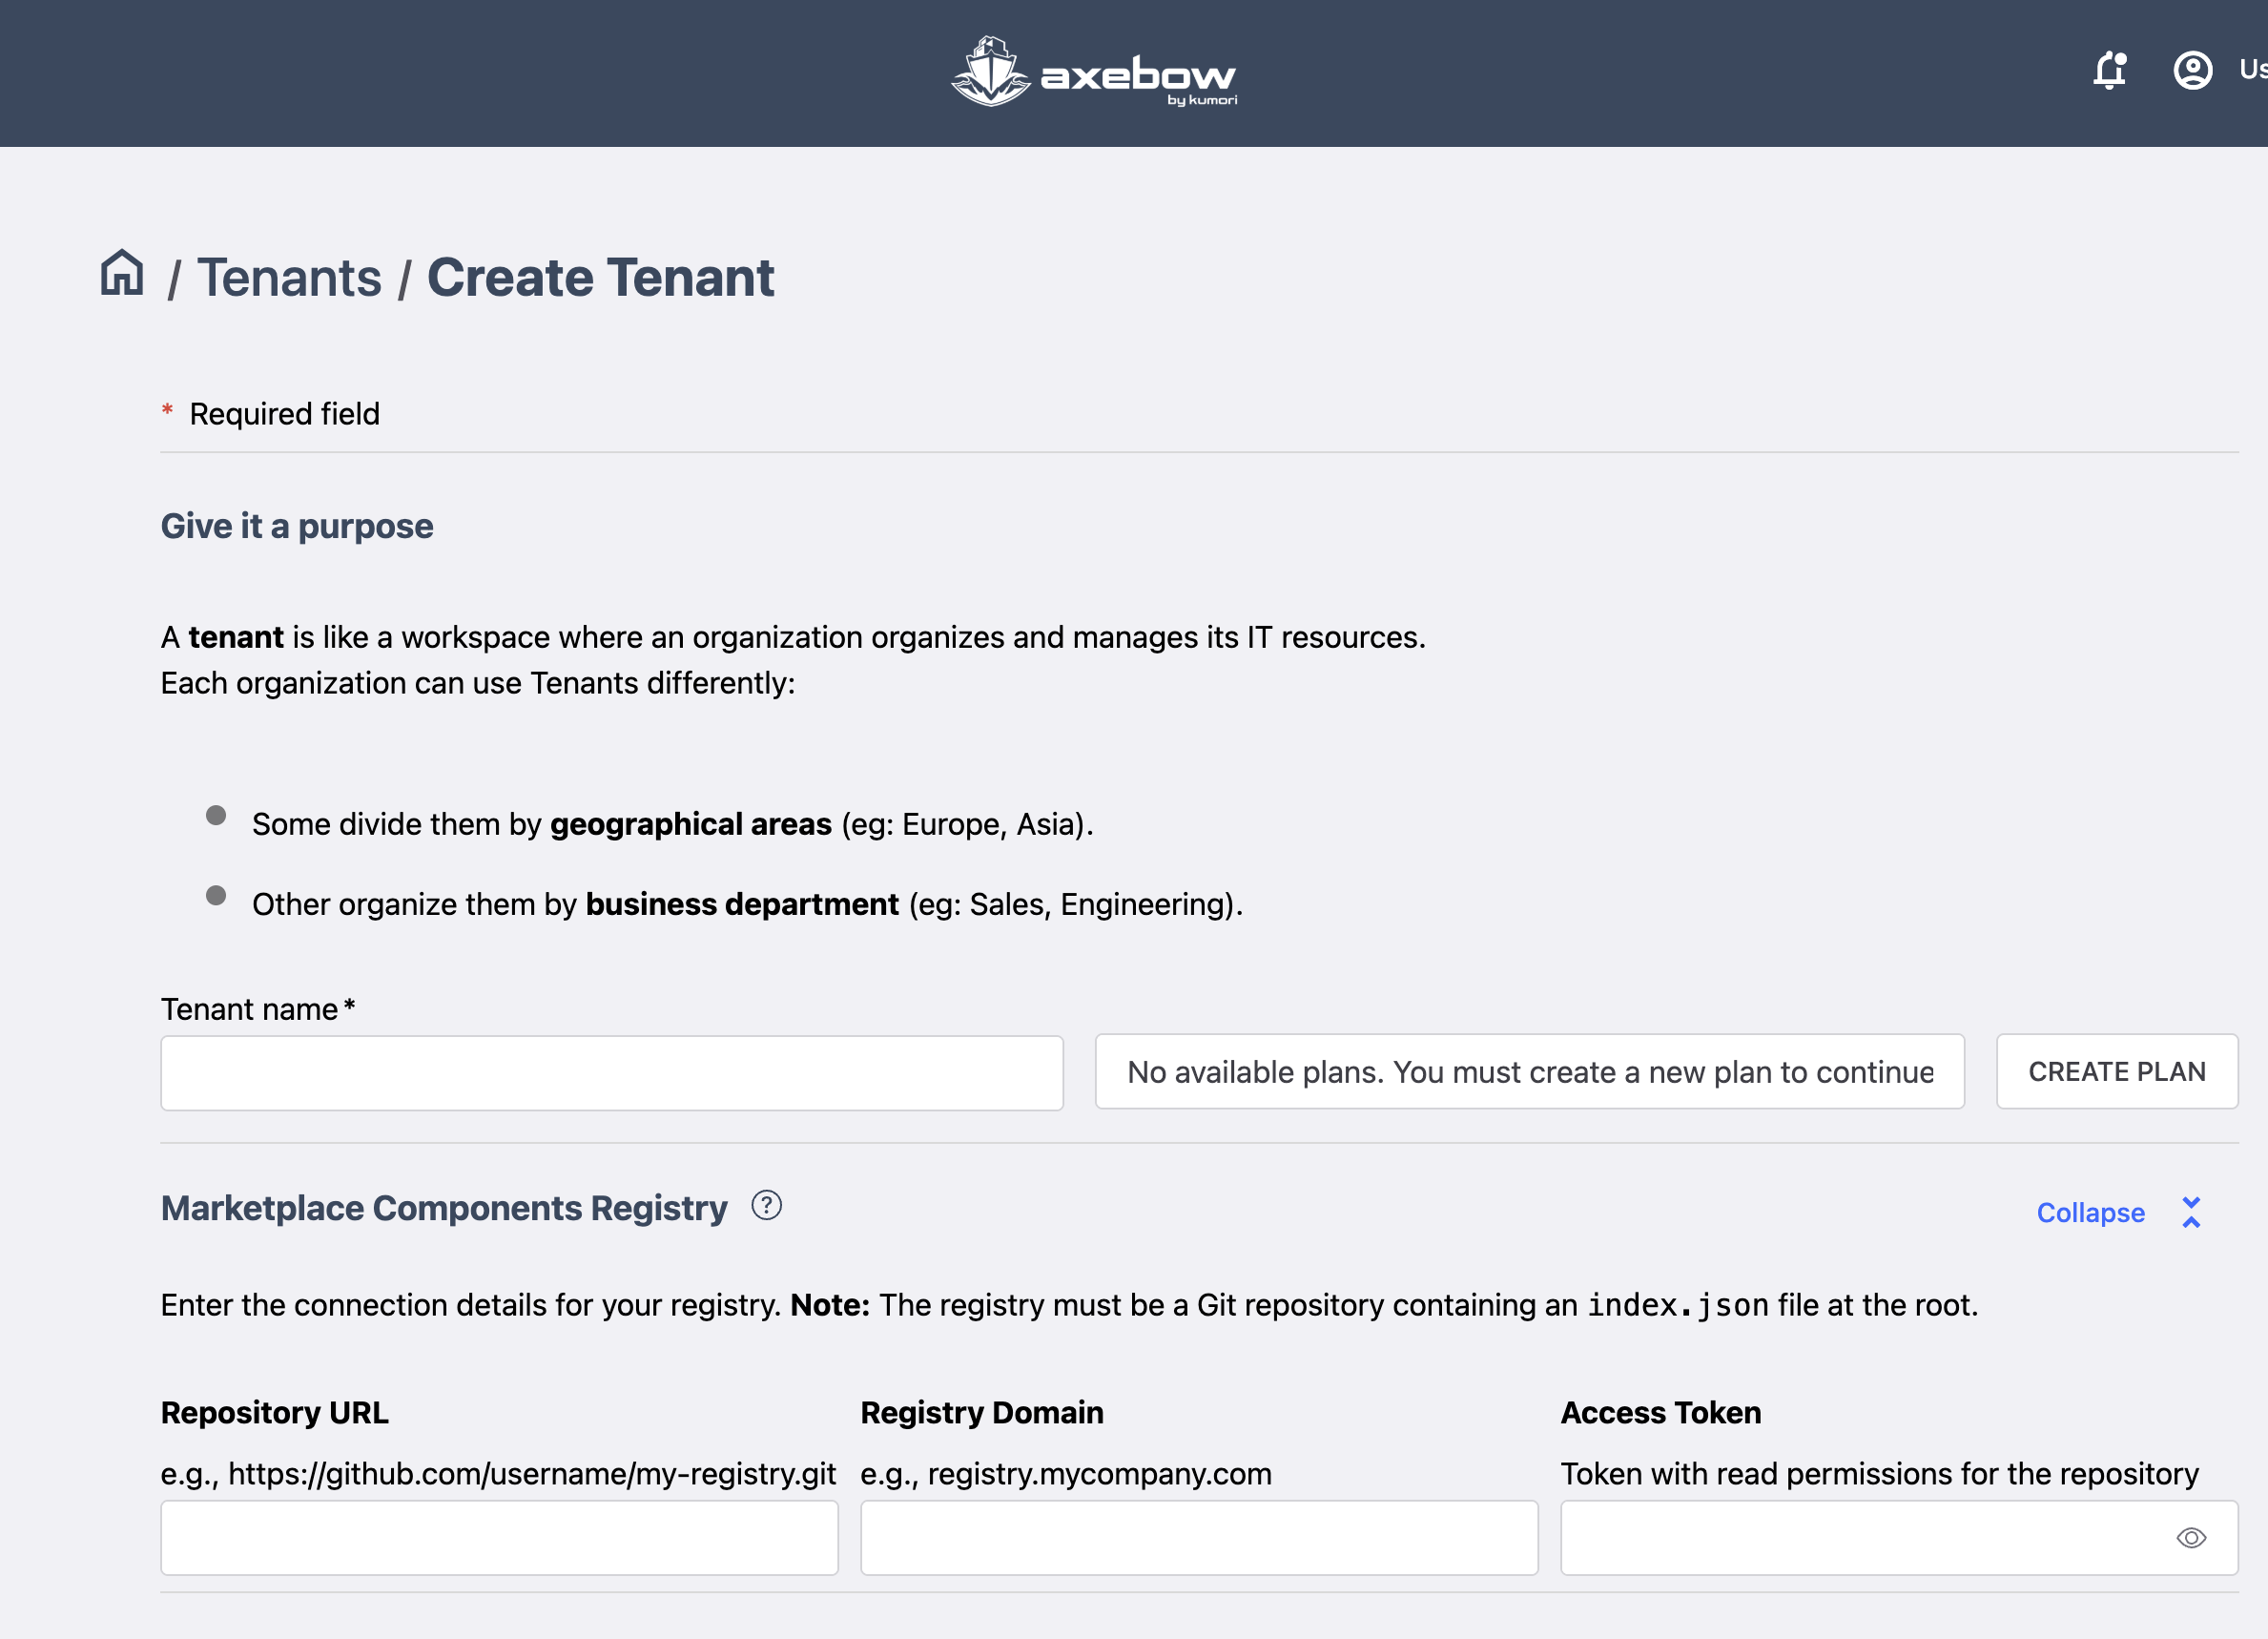
Plans can be selected through the Available plans field. Near it, the user has a control that takes him to the interface for plan creation.
Managing a tenant also includes managing the accounts within that tenant. A natural action to carry out after tenant creation is account creation, that can also be accessed from the quick action menu.
4.2 Account creation
To create an Account, the flow is divided into three steps.
Step 1: Basic data and cloud provider
The user must:
select the Tenant where the Account will be created
assign a name to the Account
ImportantThe name of the account is scoped to the name of the tenant it belongs to. Different tenants can have equally named accounts.
choose a cloud provider
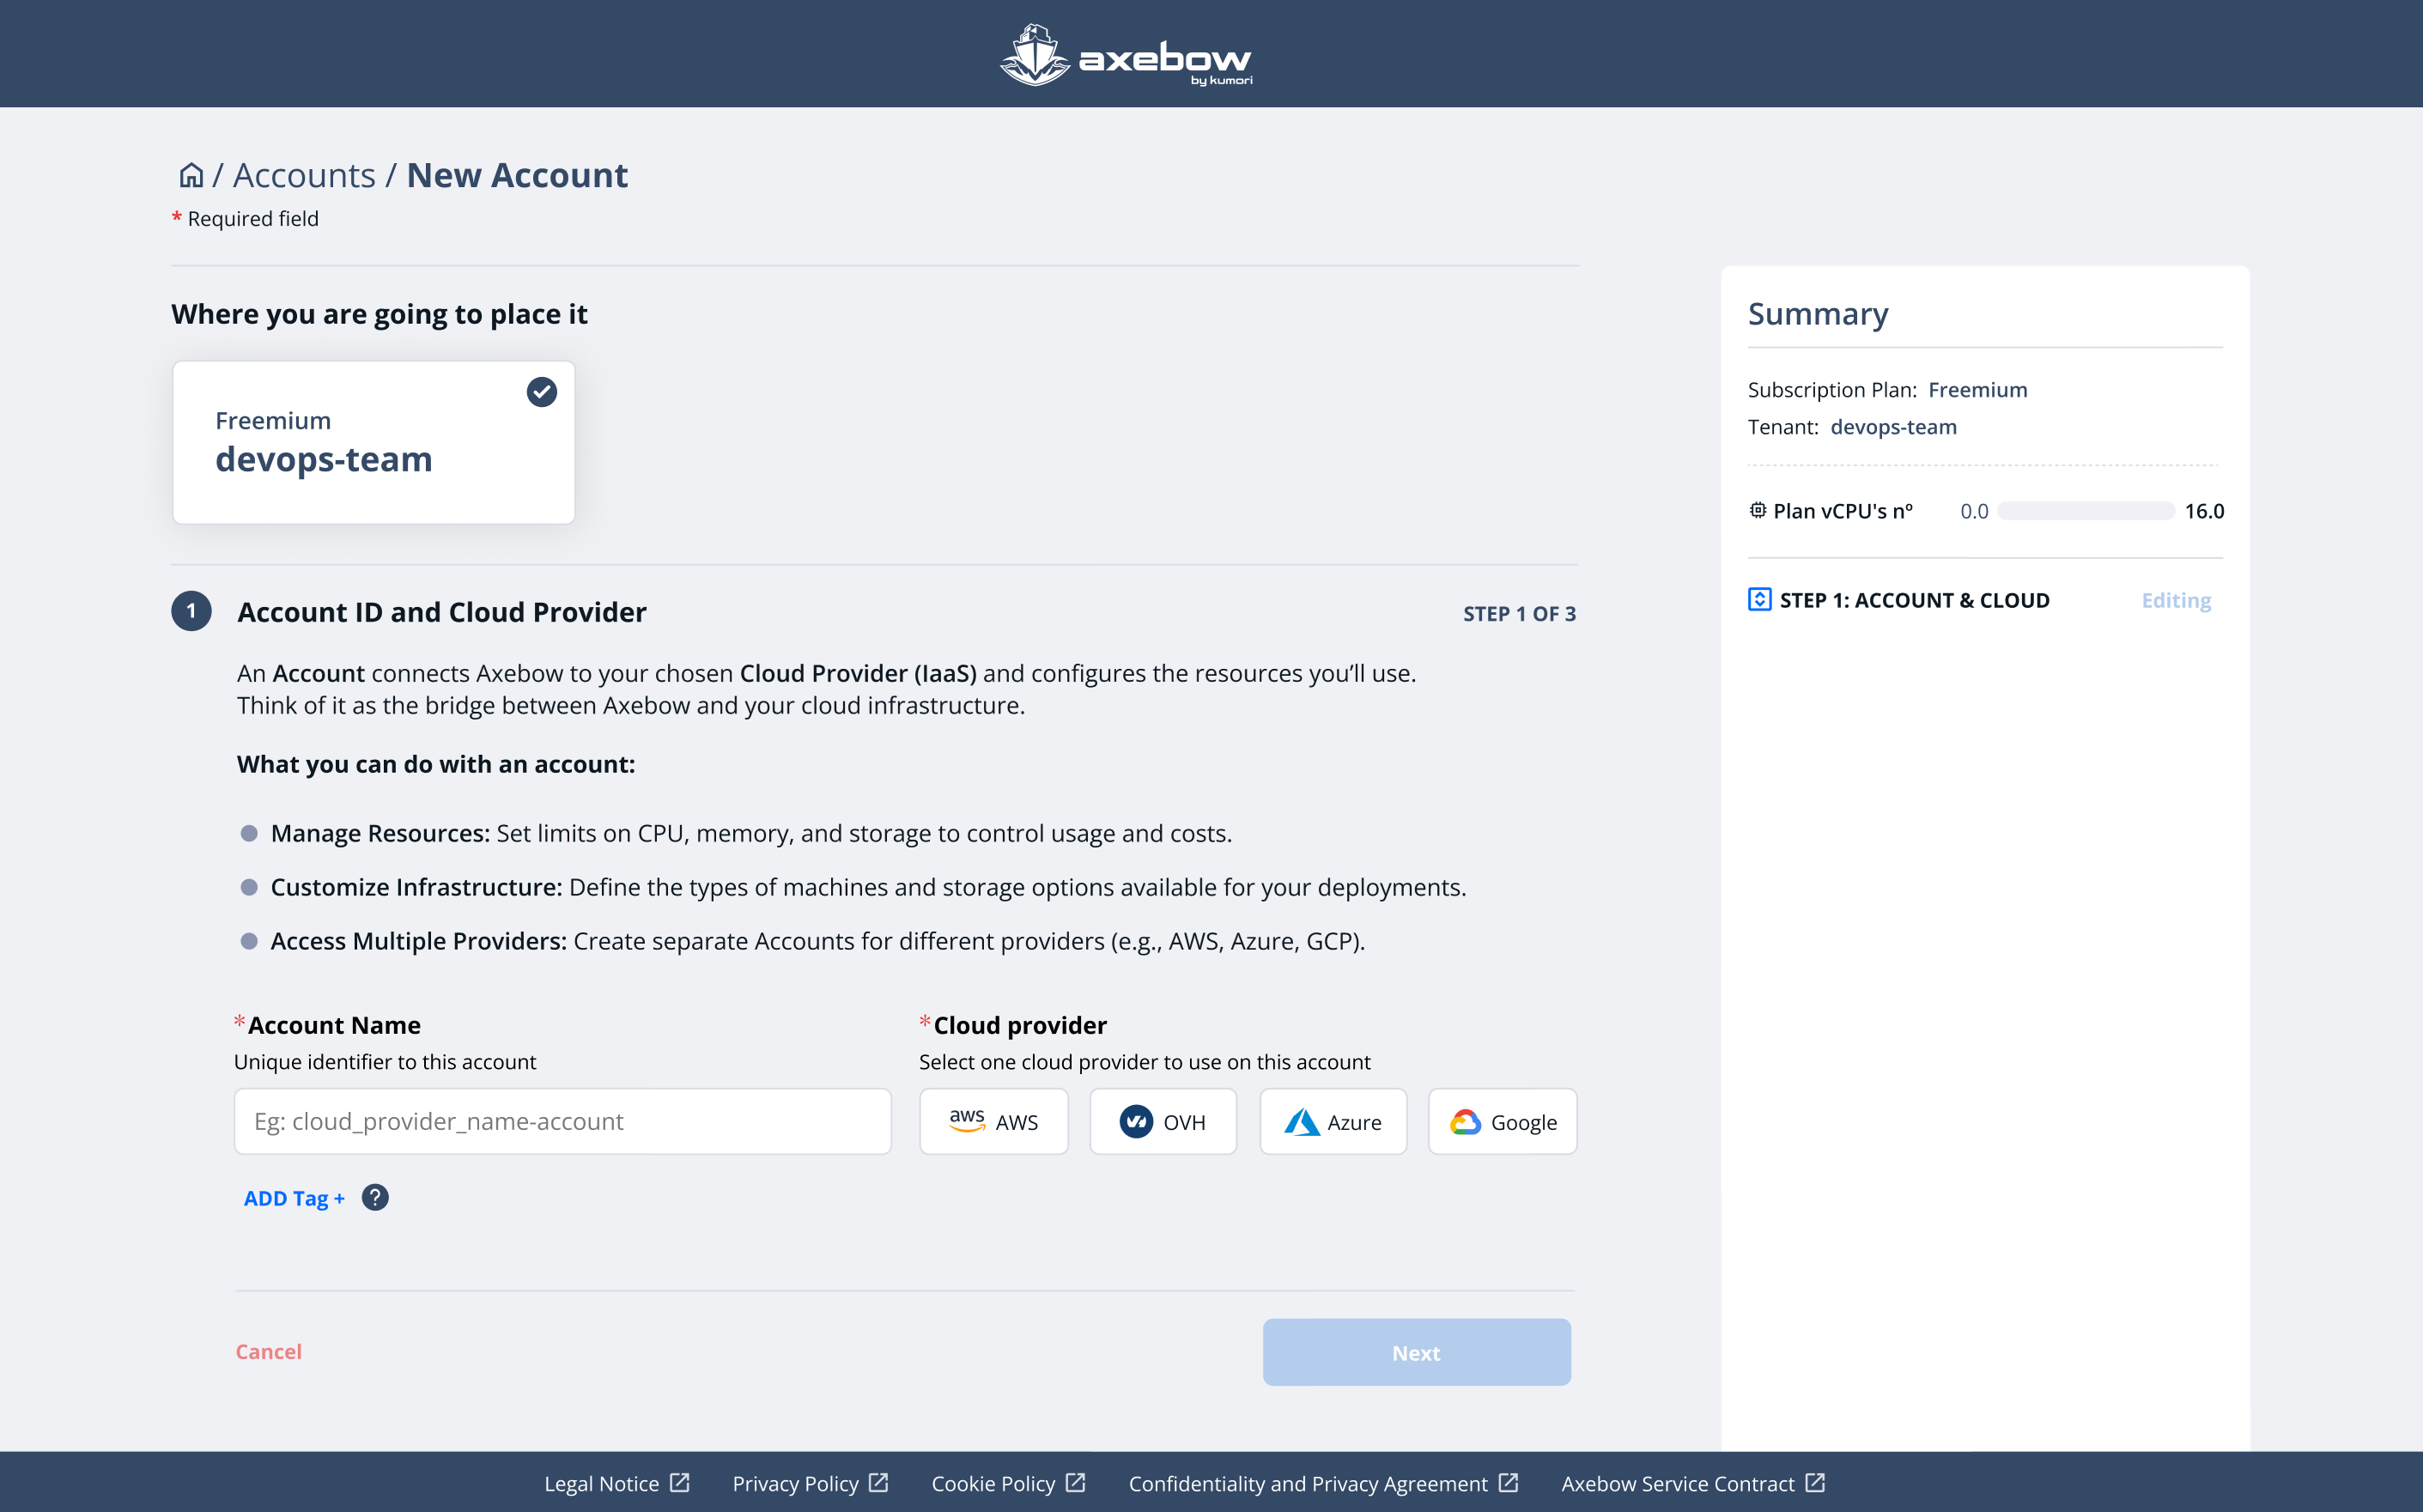
Currently supported IaaS:
| Integrated with | |
| OVHCloud | |
| AWS | |
| Azure | |
| Oasix | |
| Coming soon | |
| GCP | |
After selecting the cloud provider, the interface displays the corresponding form so the user can enter their credentials and allow Axebow to connect to their cloud (for example, OVH).
Two options are available:
Via credentials access
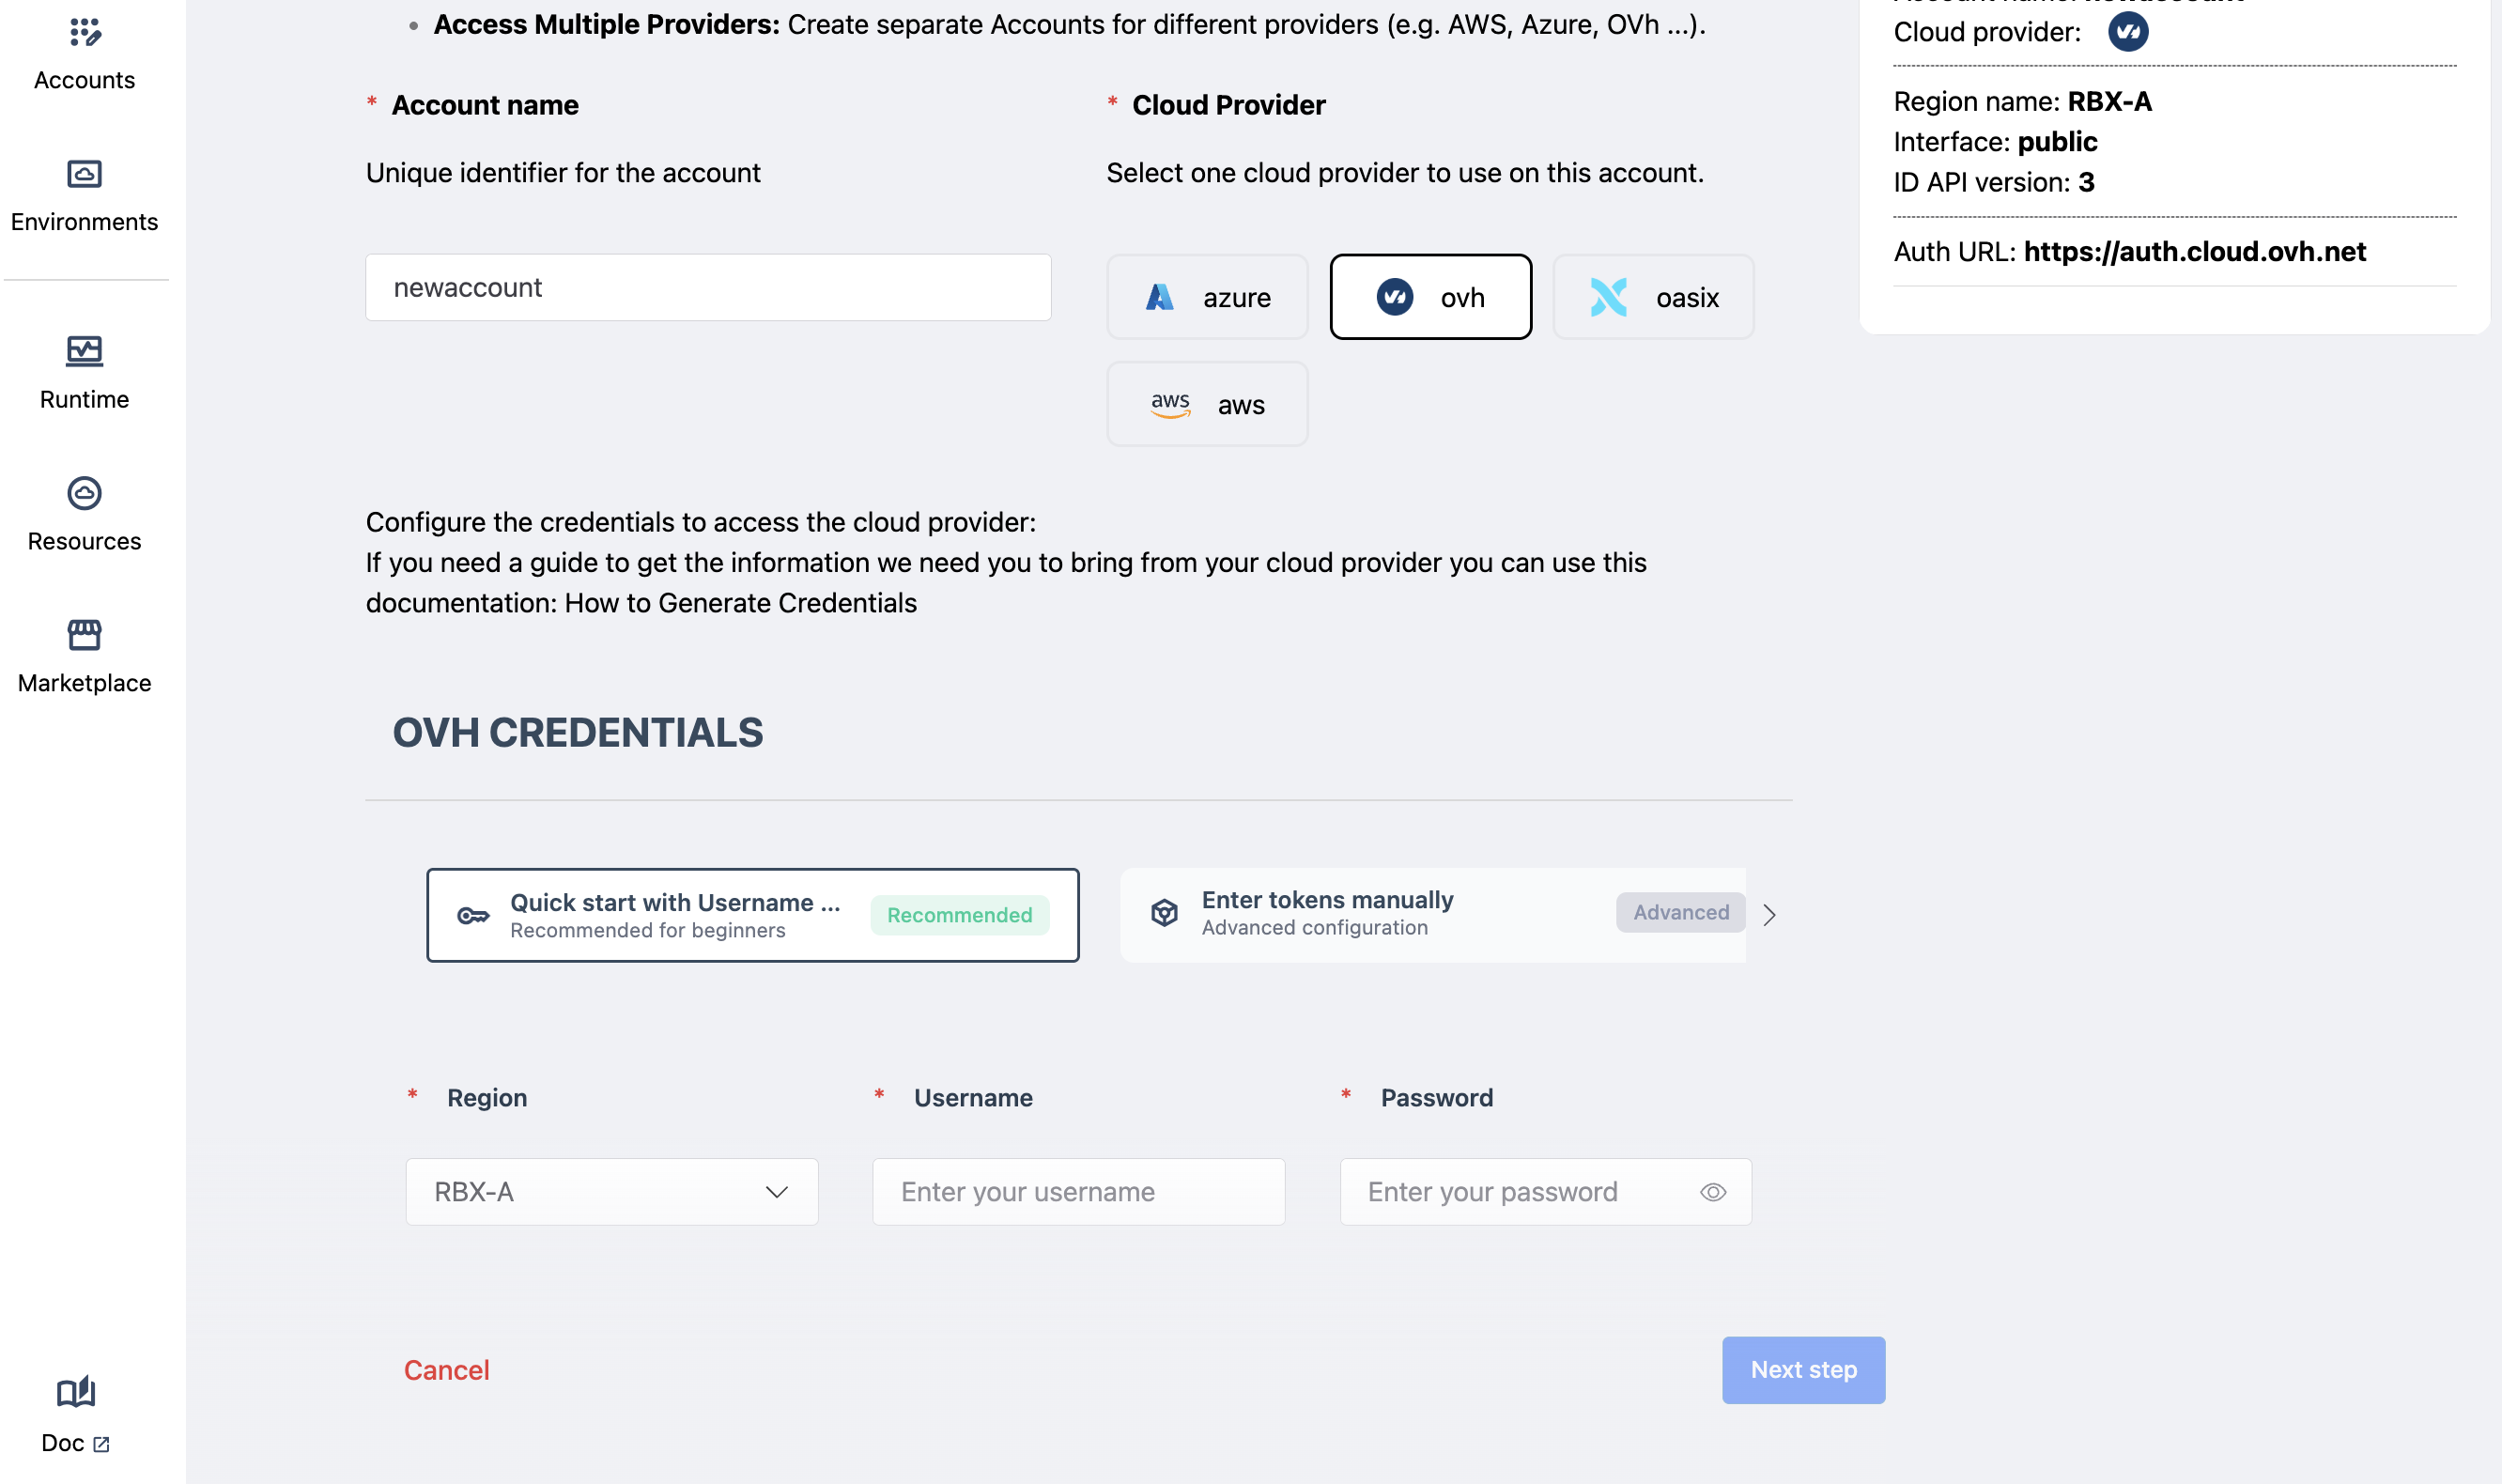
Via tokens access
The fields required and shown in our interface are dependant on the IaaS selected in the previous step. The above figure shows the fields needed when selecting OVH and deciding to enter admin credentials.
Note that when entering the admin credentials, Axebow uses them to obtain a token with which to carry out the reservations and releases of IaaS resources. Axebow does not store the supplied admin credentials. Thus, when admin credentials are used to create an account, they should also be provided to delete it.
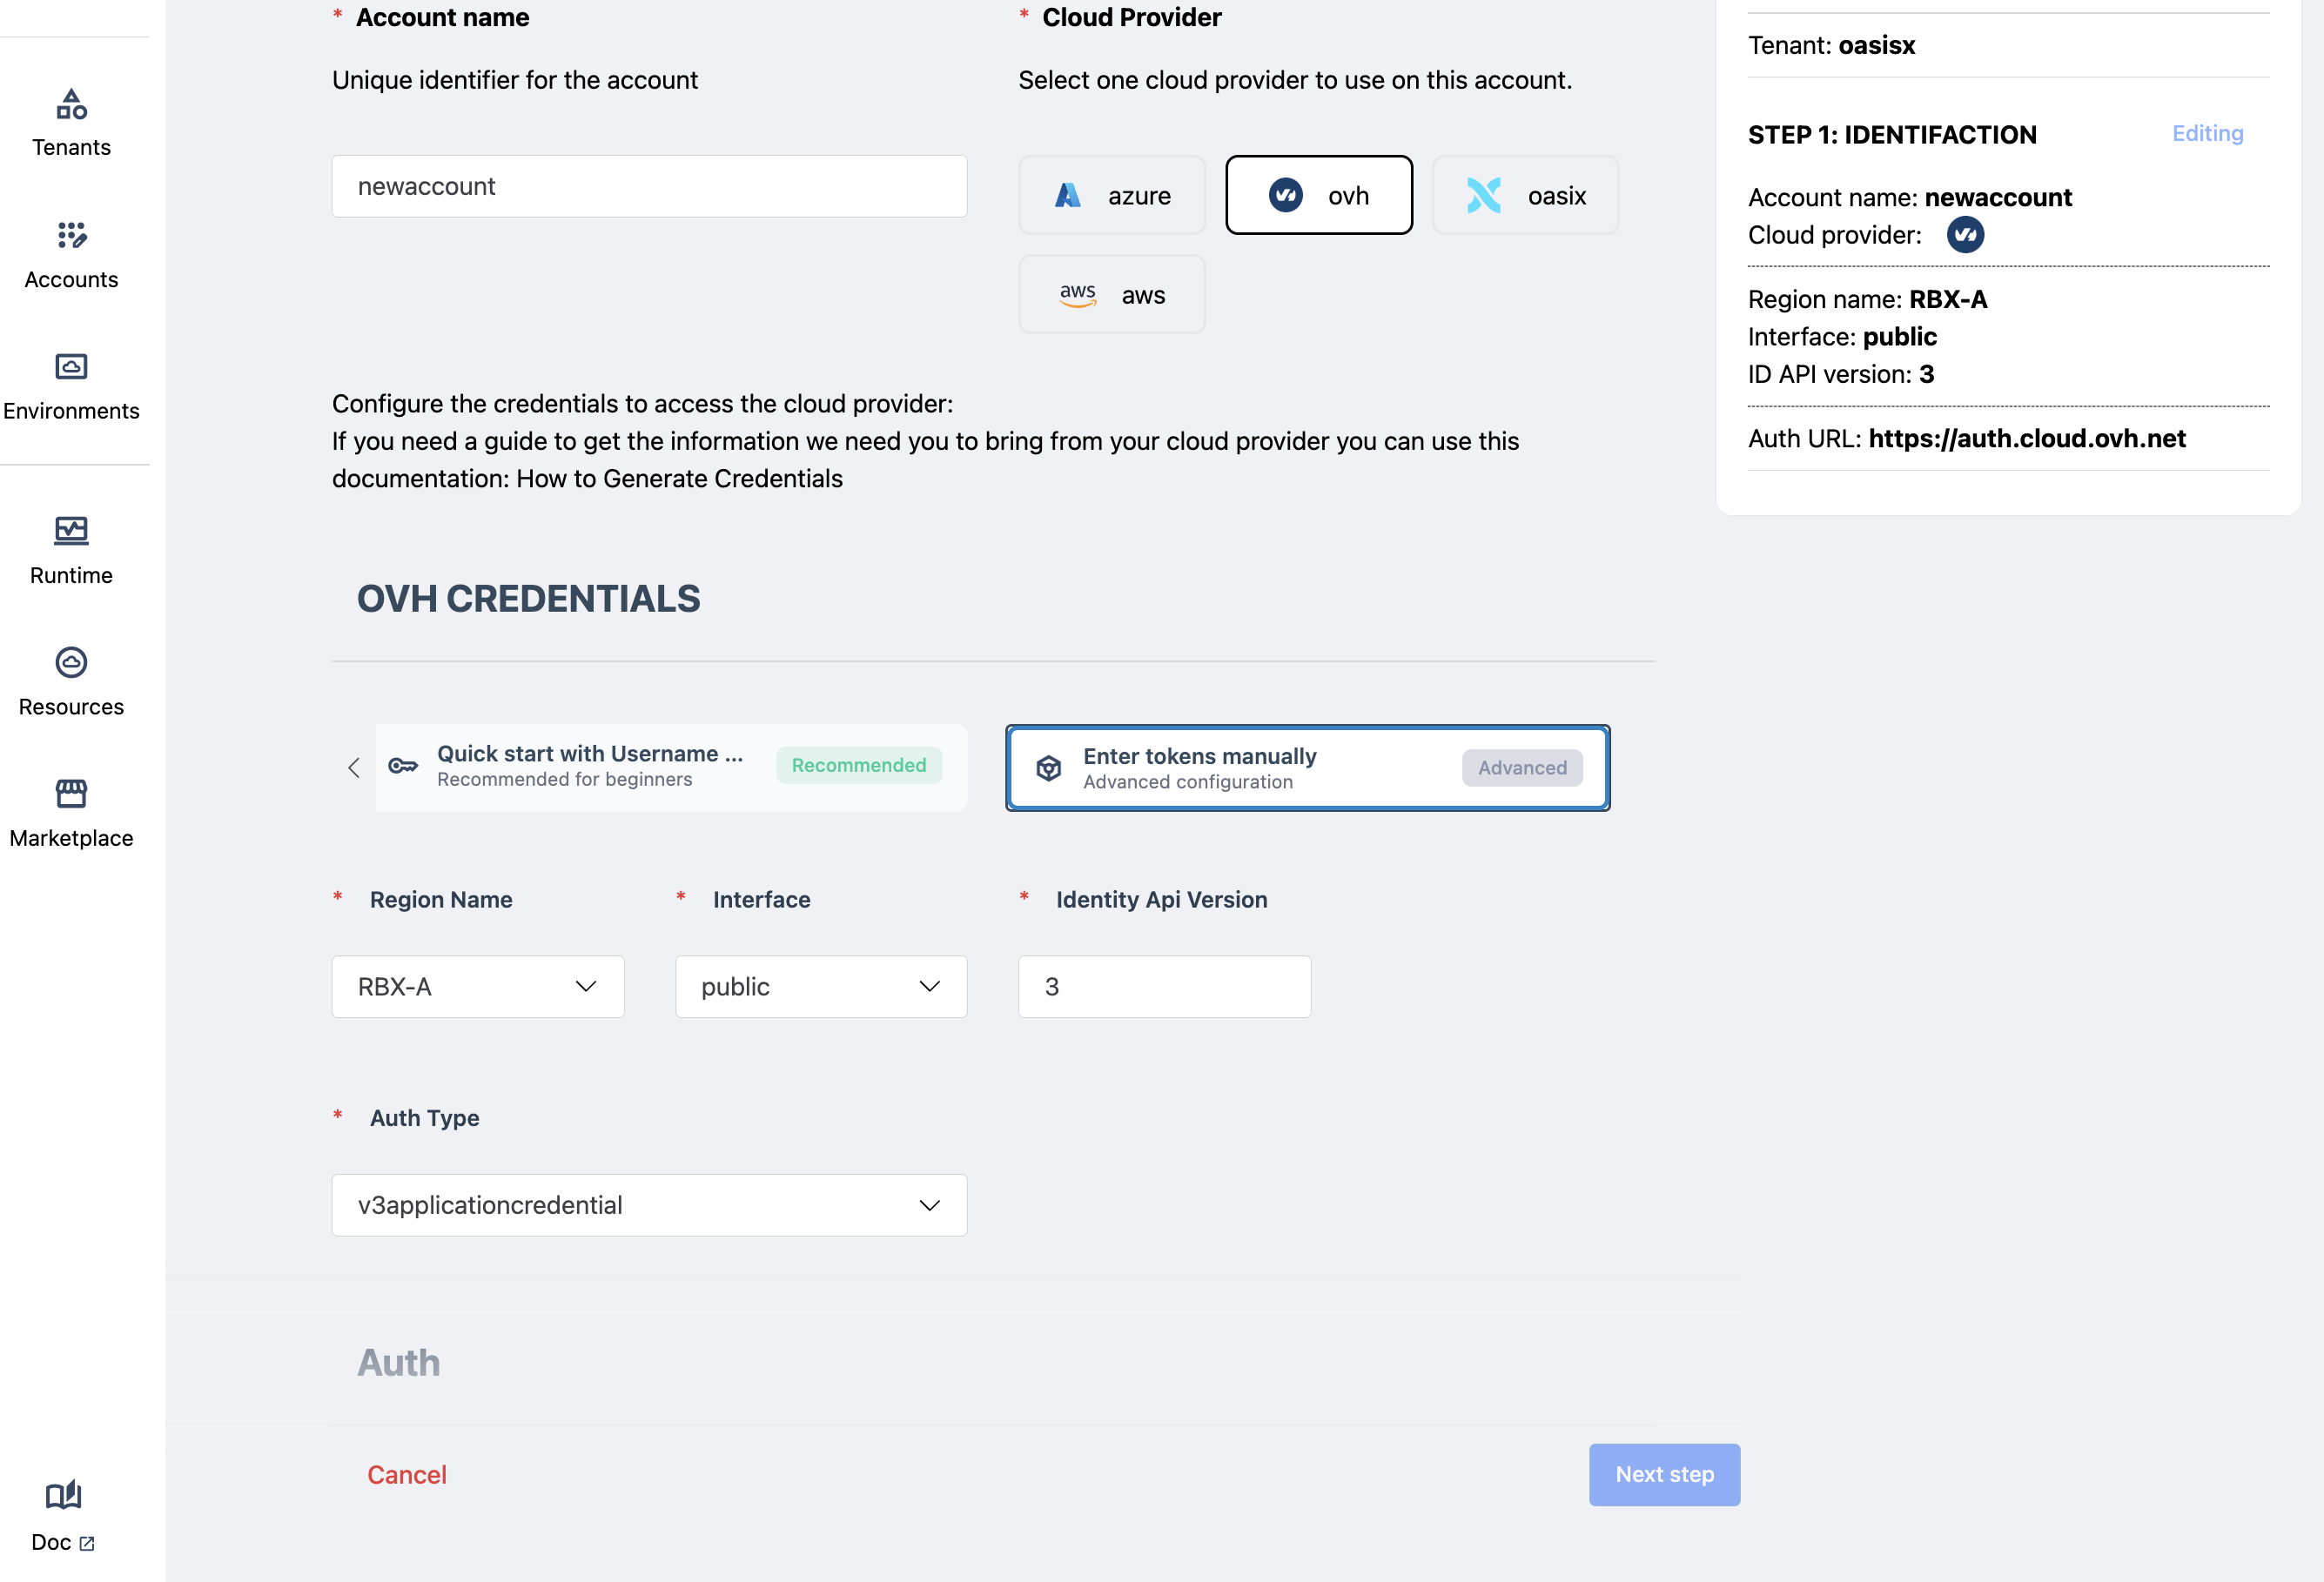
If a token is introduced, it should be obtained from the IaaS provider, and entered here. The next figure shows the fields in this case for OVH.
Tokens typically expire. When a token in an account expires, no operations entailing requests to the IaaS will be carried out (typically as a result of deploying a service that requires allocation of IaaS resources)
Credentials are checked for validity. If supplied credentials are not valid the account will not be usable.
Most IaaS providers (all the ones supported thus far) will usually require to specify the region where the infrastructure will be allocated. Depending on the IaaS, different regions may have different VM and storage flavors and different resilience characteristics. The user should decide which region best fits his needs.
Step 2: Define characteristics
Once the previous step is successfully completed, the Next CTA is automatically enabled, allowing the user to define the Account’s characteristics.
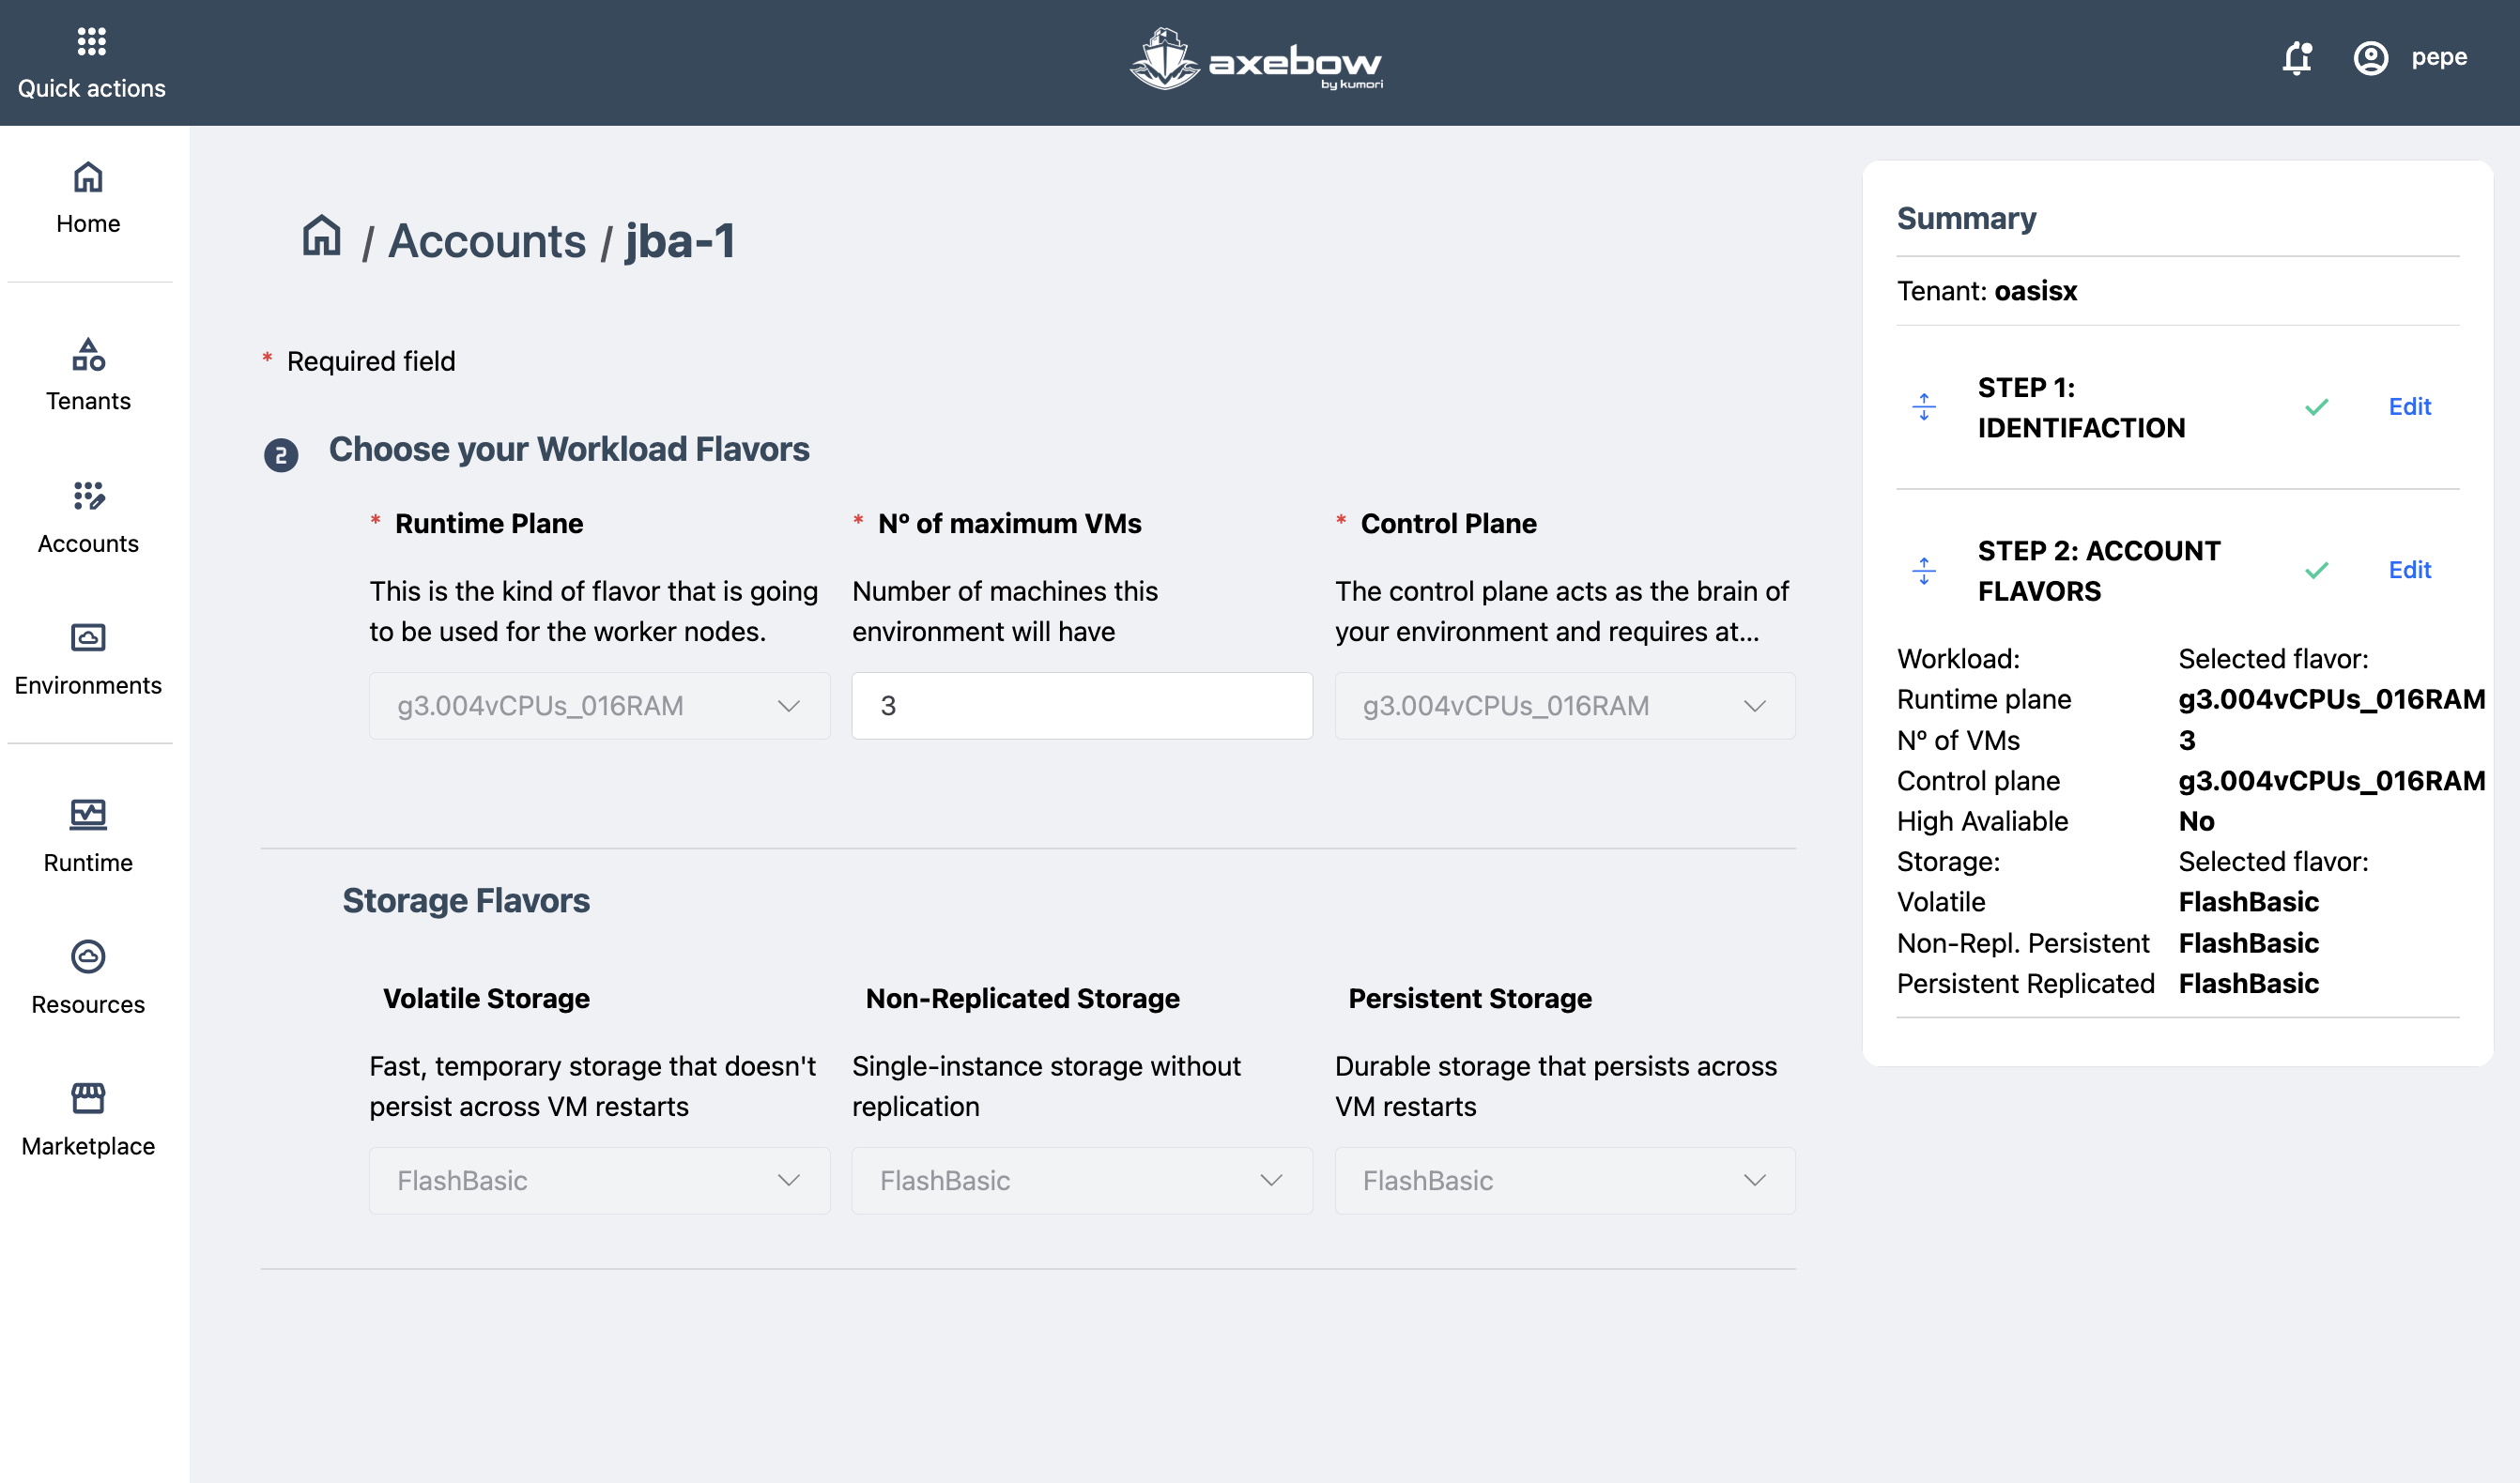
The user must sekect the VM flavors that will be used on all clusters of the account. Two flavors must be selected, one for the master nodes of the clusters and another for the worker nodes.
Additionally, flavors must be chosen for eacvh one of the storage classes Axebow handles
- Persistent
- Storage with strong durability guarantees, typically as a result of a configuration utilizing replication.
- Non-replicated
- Storage that is guaranteed to persist accross service restarts but offers no guarantees if the storage itself fails. This storage may be indicated when the service itself implements some HA strategy, thus trying to avoid wasteful replication at two levels.
- Volatile
- Storage that is not guaranteed to persist accross service restarts
Throughout the flow, the interface displays a Summary side panel that reflects the selected configuration in real time, helping detect errors or inconsistencies early.
Step 3 Setup spending limits
The maximum amounts of computational resources that, in total, can be used by the different applications deployed in the environments created in the account shall be indicated.
There are two sections for limits: soft and hard limits. The page always shows the hard limit form.
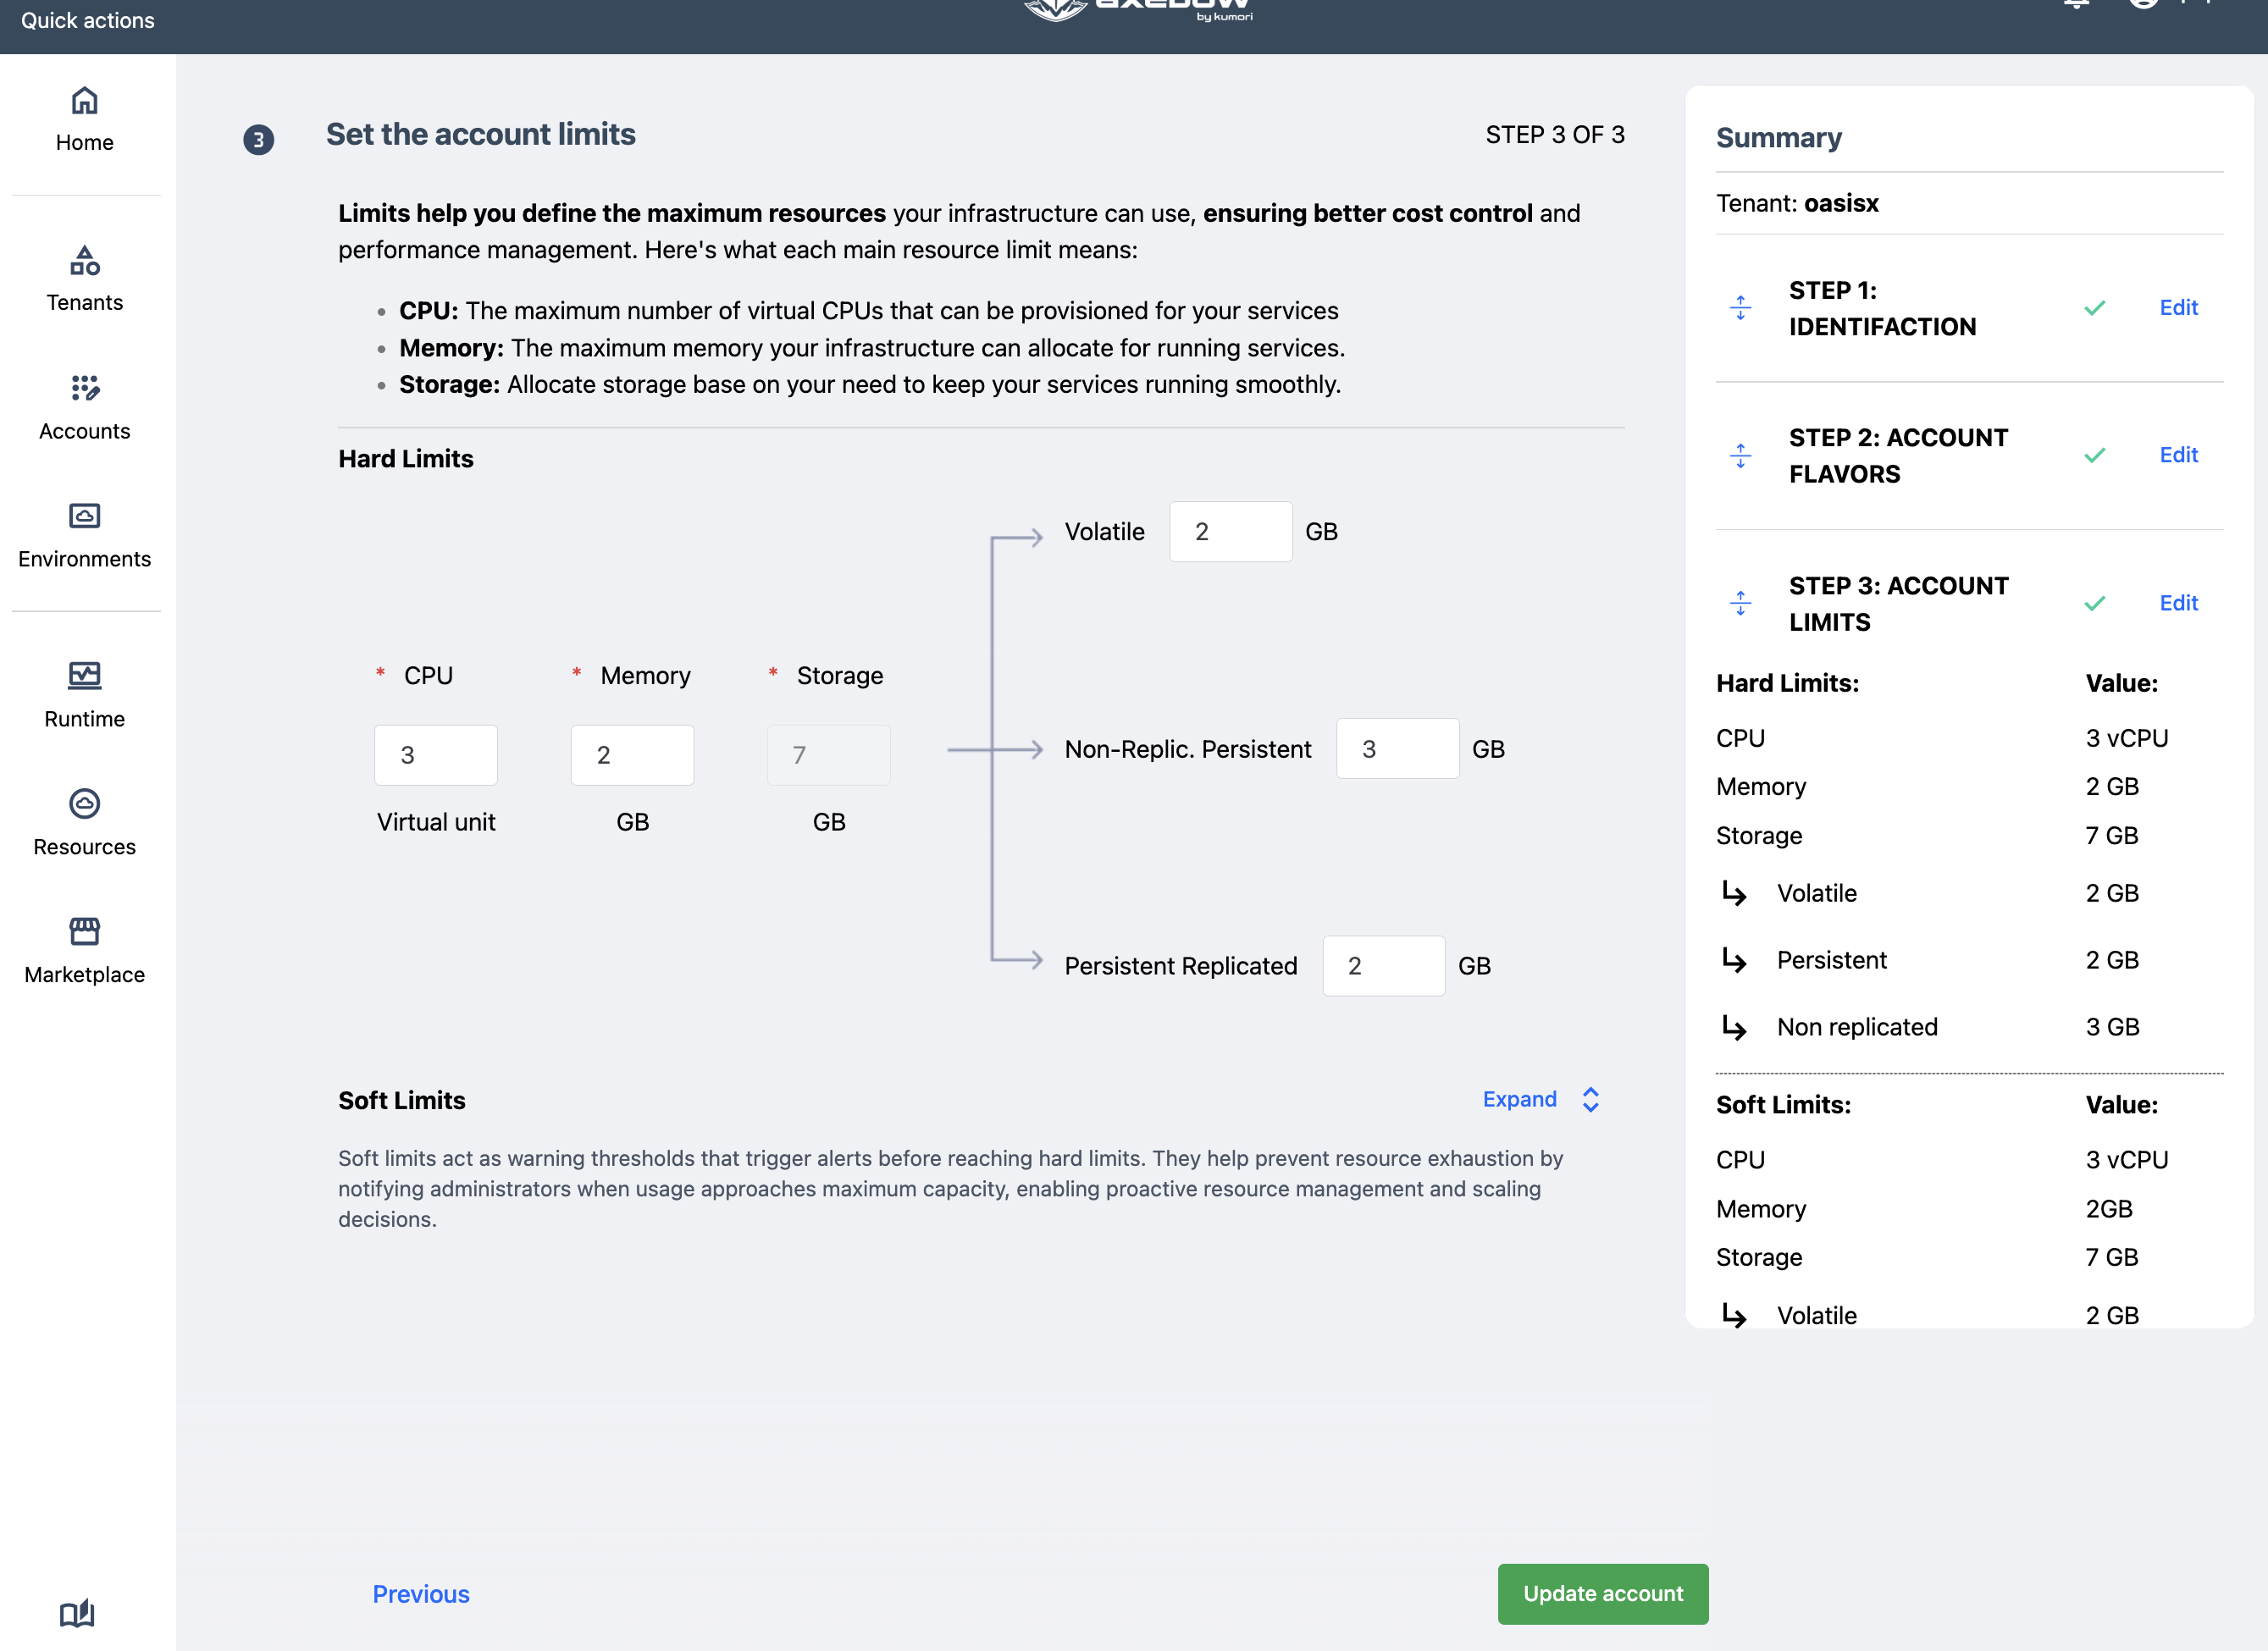
Hard limits inform of the a bsolute maximum resources to be spent within the account by any user. If a user tries to deploy a service that would make the resource consumption go beyond the limits, the deployment will not proceed.
The soft limits form can be optionally shown and filled. Initially their values are identical to those provided for the hard limits.
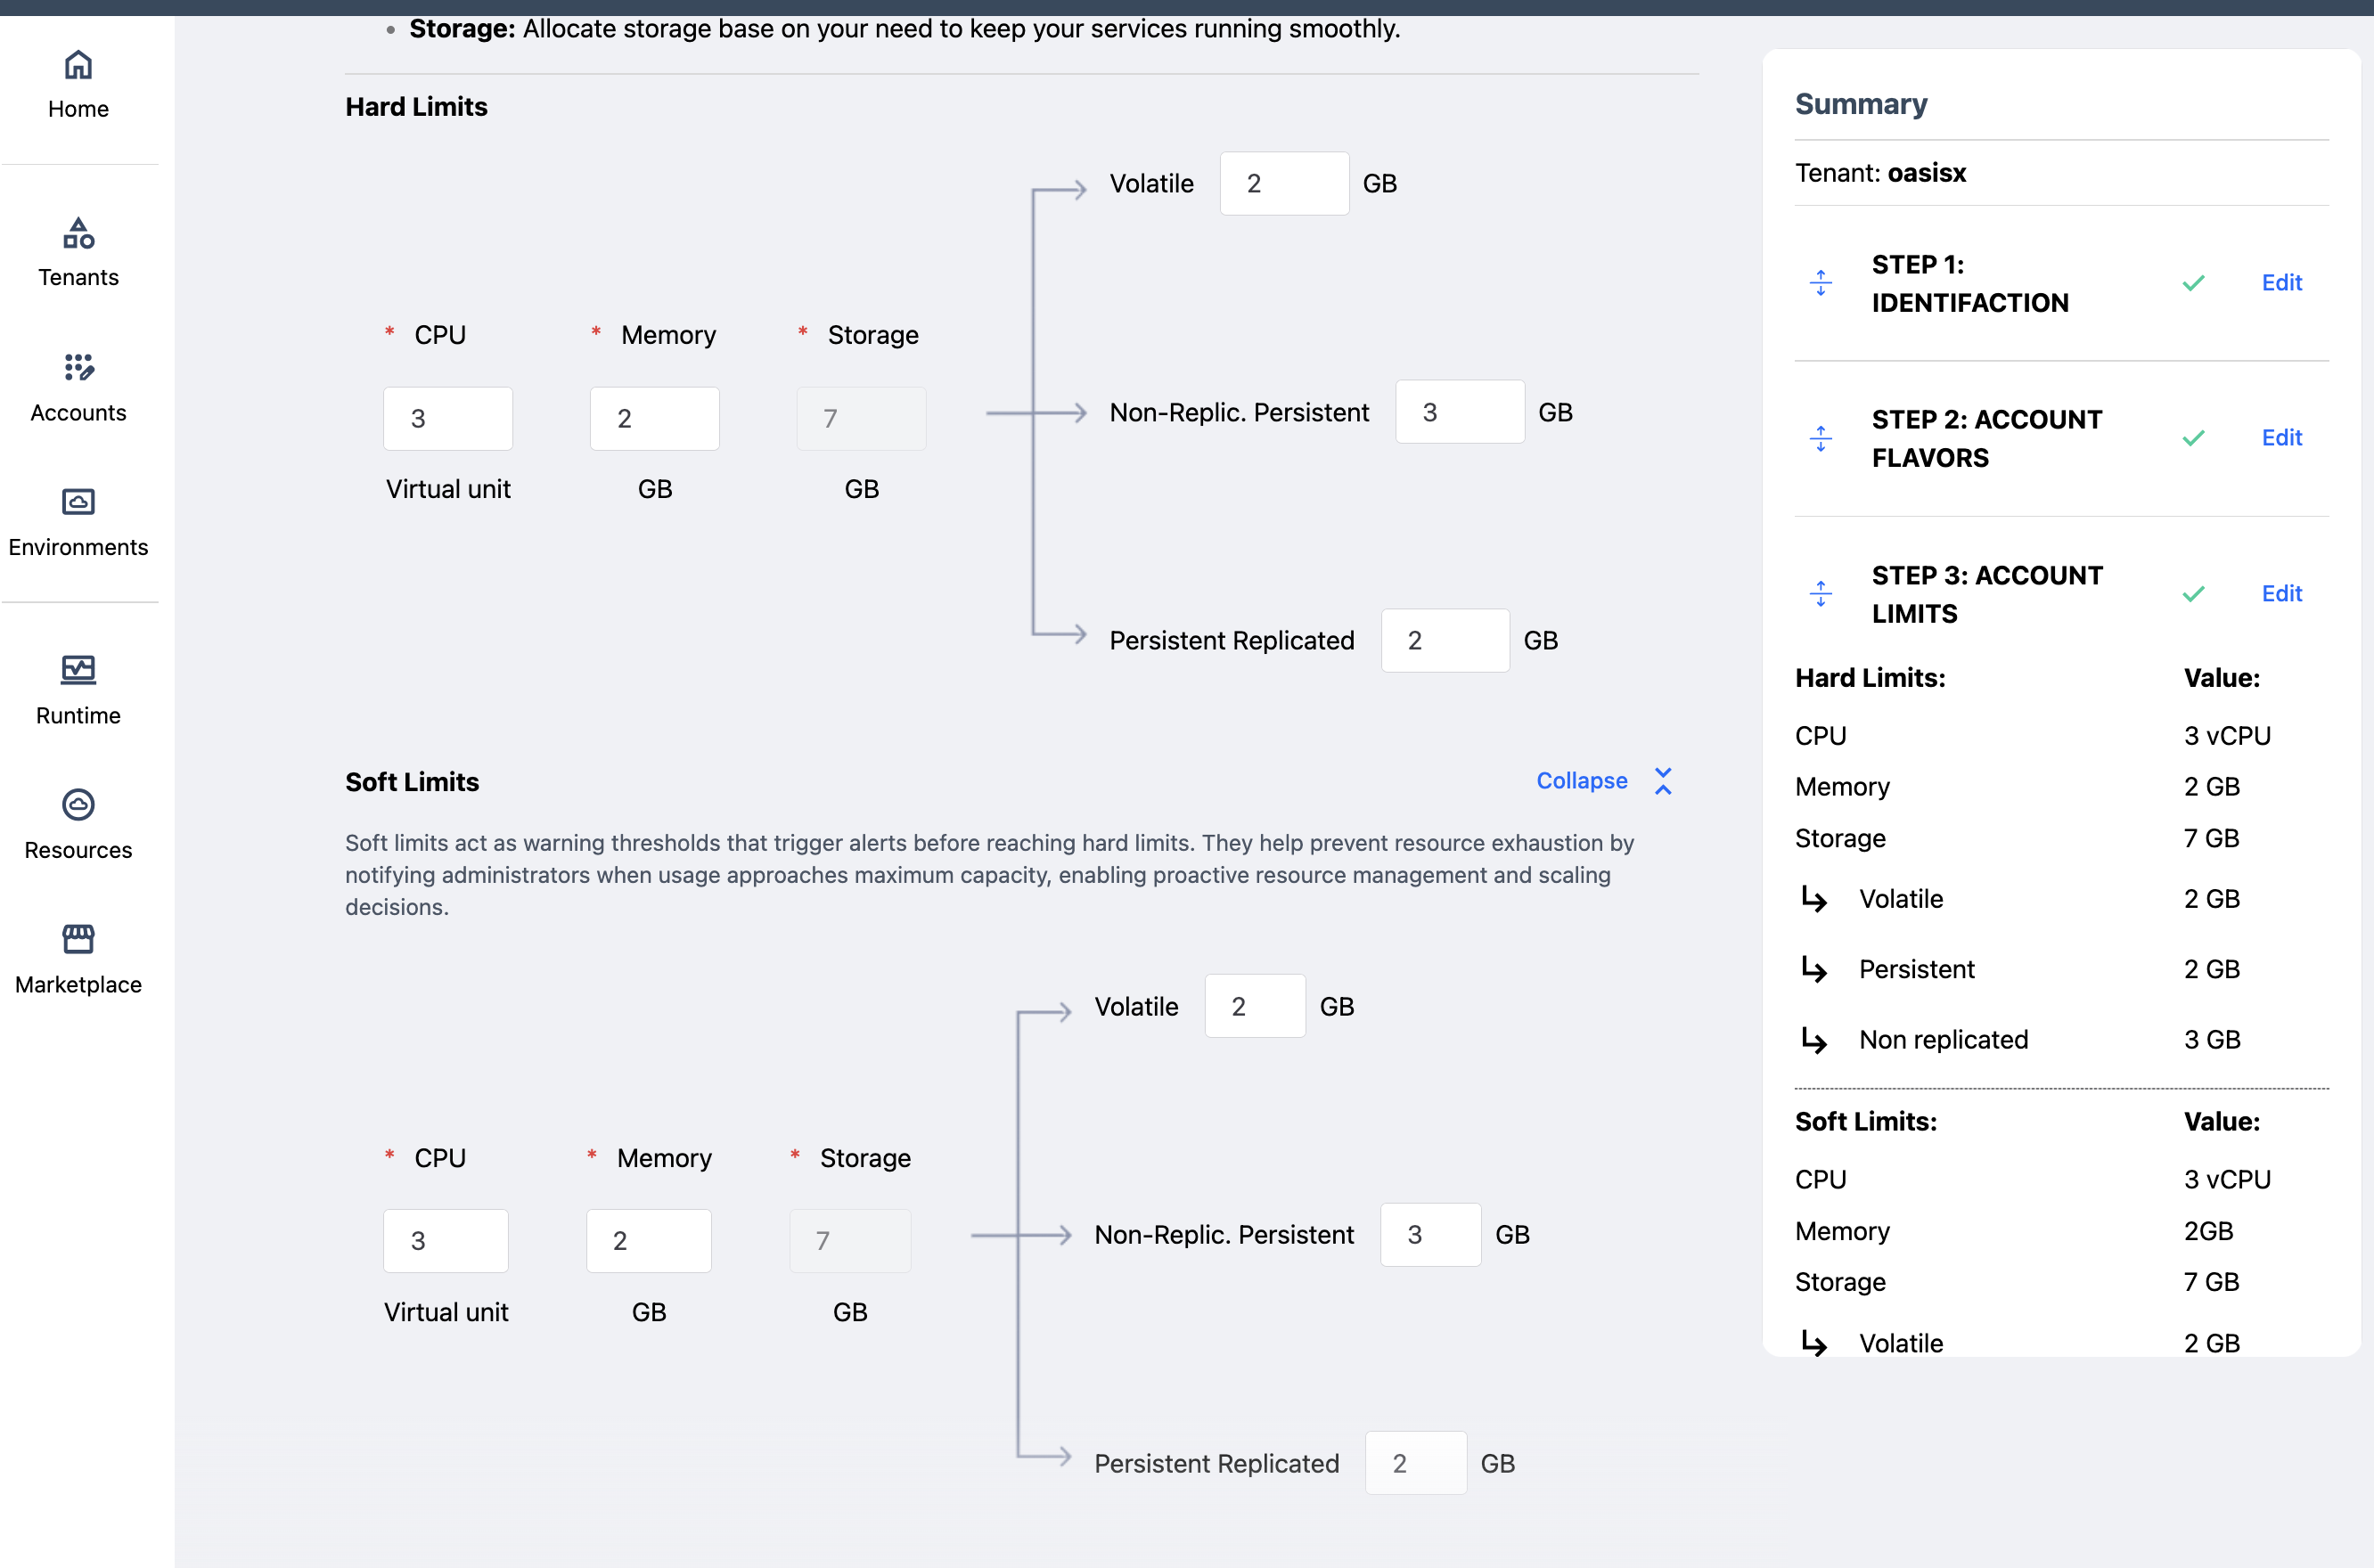
Soft limits, on the other hand, work as an early warning that resources set up for an account are reaching dangerous levels. Thus, if a user tries to deploy a service that would increase resource usage beyond the soft limits then the deployment would be blocked until a tenant admin allowed it to proceed.
Soft limits can never be larger than hard limits.
4.3 Account modification
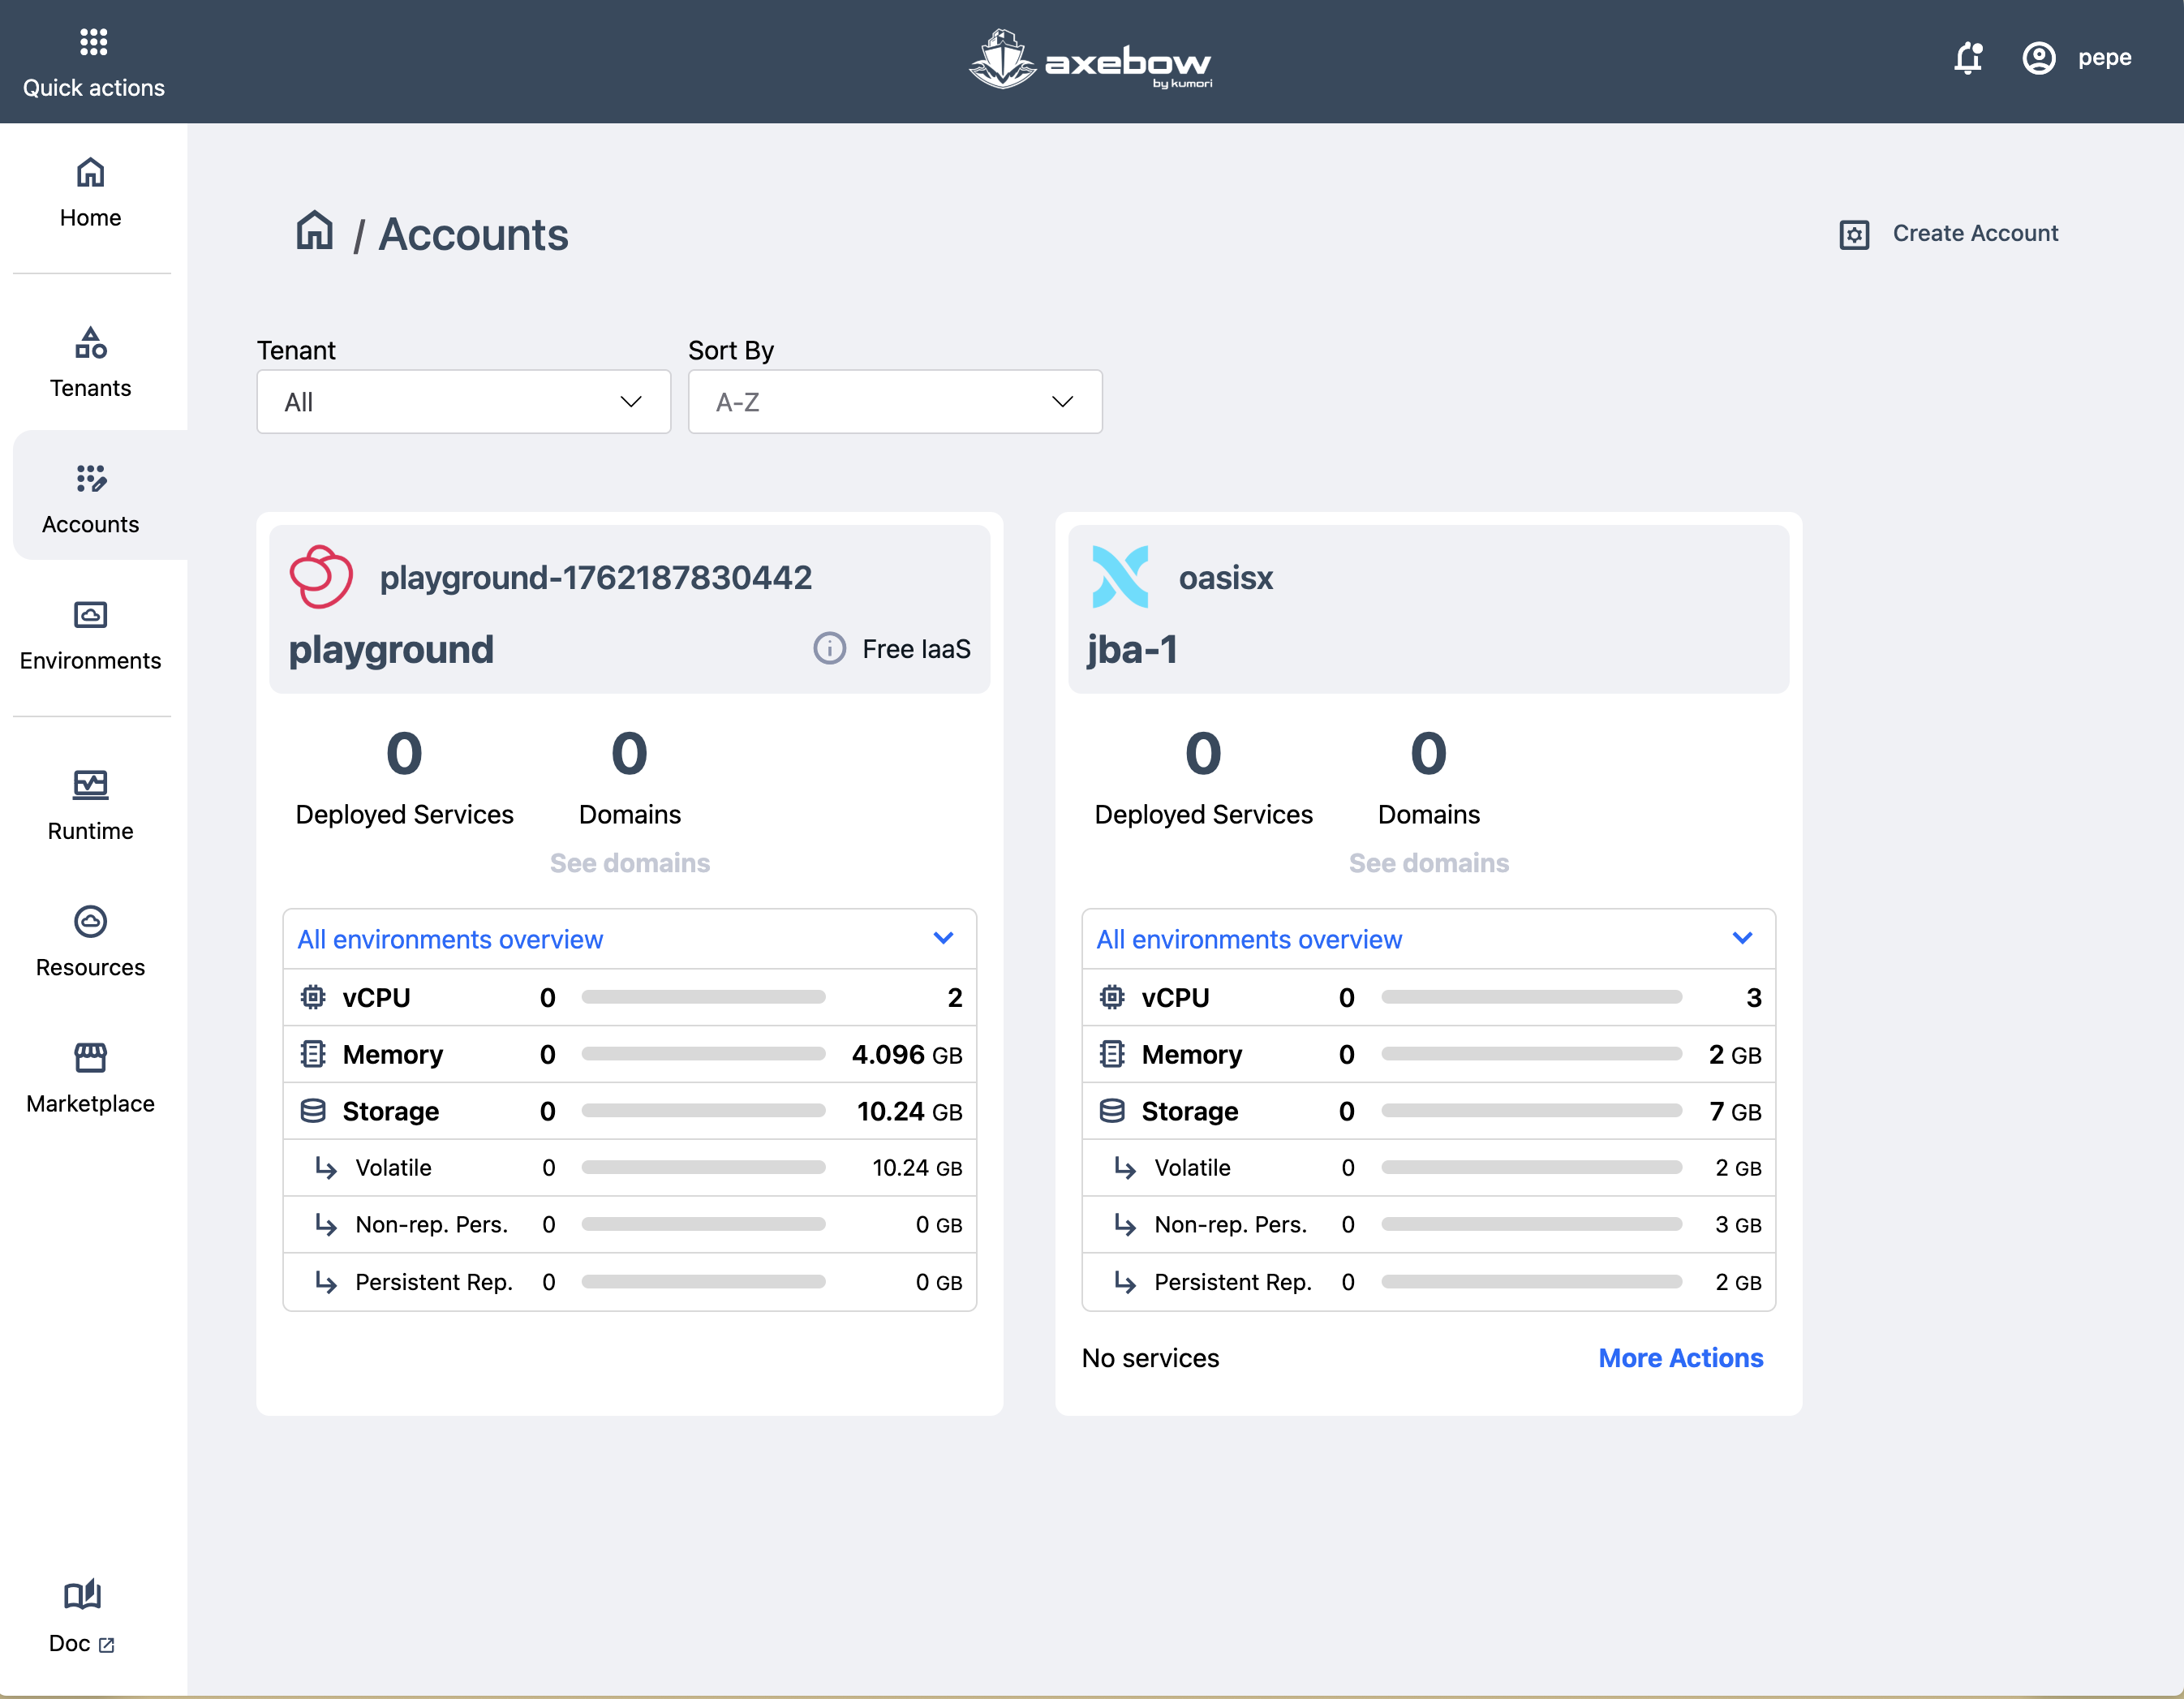
Once the Account is created, it is added to the Accounts dashboard (reachable via the sidepannel option)
Accounts in that page can be edited by selecting the “Edit Account” action within the submenu at the lower left part of the card.
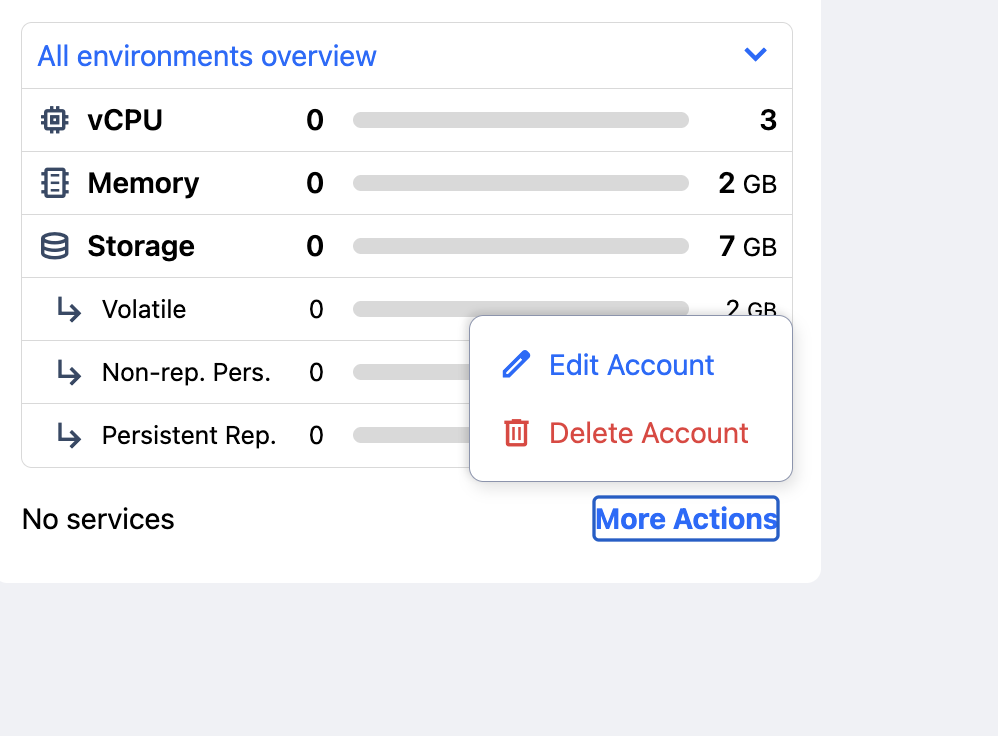
Edition of the account will take the user through the same steps as its creation.
If credentials become invalidated for some reason, the only editing possible is to change the account credentials.
In order for Axebow to be able to release the resources it reserved at the IaaS it is necessary that the credentials of the account be valid. Thus, if they become invalid and clusters have been allocated, the account should be updated with valid credentials.
4.4 Creating an Environment
The environment creation process shares many aspects with that for account creation. To create an Environment, the flow consists of two steps.
Step 1: General configuration and environment details
The user must:
select the Account where the Environment will be located
assign a name to the Environment
ImportantSimilarly to account names, environment names are scoped to their accounts. Thus the same environment name can be used for different accounts if it makes sense.
define its main characteristics (flavors, HA)
If the user is creating their first environment, the interface automatically selects the only available Account at the top carrousel of the dashboard.
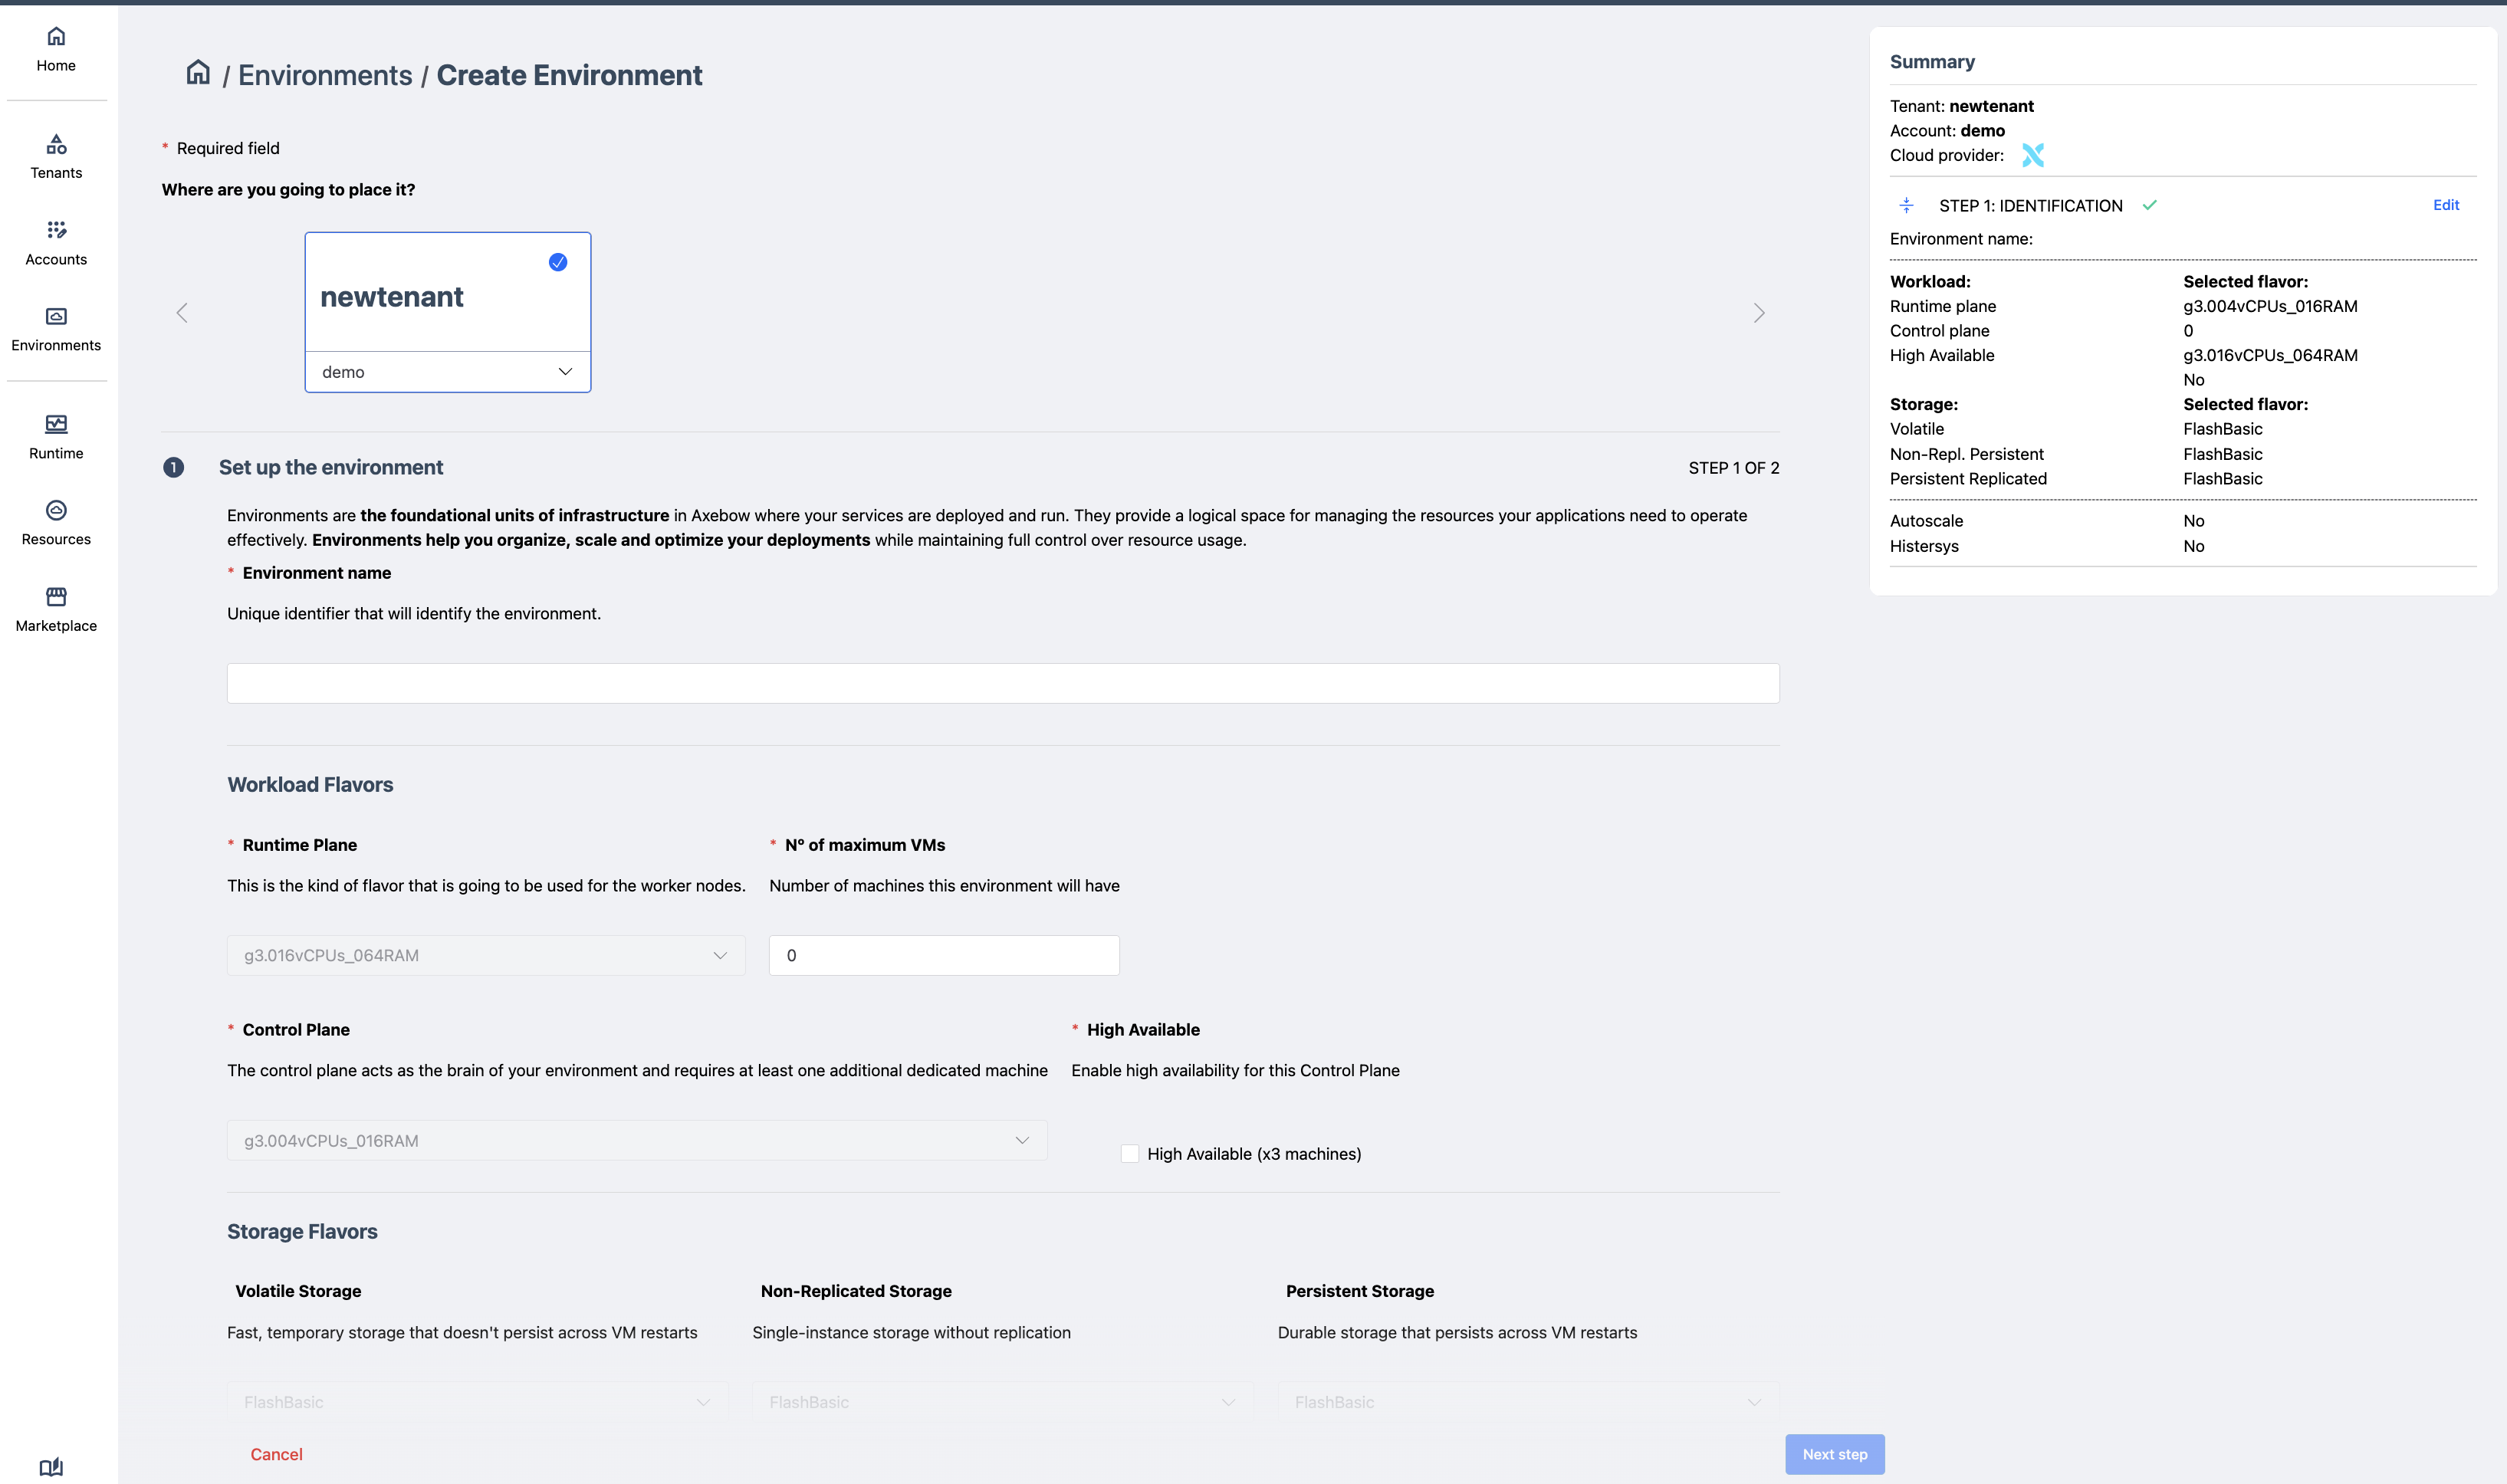
An environment is restricted to use flavors configured for its account. The user is given the chance to select those flavors now, constraining them further.
Additionally, given that the environment controls the cluster on which services will be run, Axebow also requests additional information to properly manage the cluster it may create:
- Maximum number of virtual machines for workers
- Axebow has a cluster autoscale feature, whereby when more VMs are needed to accomodate the load that runs on a cluster, it automatically requests more resources from the IaaS. It does so up to the limit configured for the environment,
- Highly Available Control Plane
- Option that allows ensuring the control plane has at least three masters. These nodes will be allocated in the best way possible given the selected IaaS and region (not all regions in a IaaS will offer availability zones)
Step 2: Environment spending limits
After filling out the details above, a page to fill out limits for resource consumption is presented. This page is identical to that used to set up limits for an account. As with flavors, environment limits can further restrict the limits set up by its account.
After successfully completing the flow, the basic Axebow infrastructure is fully created (Tenant → Account → Environment), and the Environment is added to the Environments dashboard.
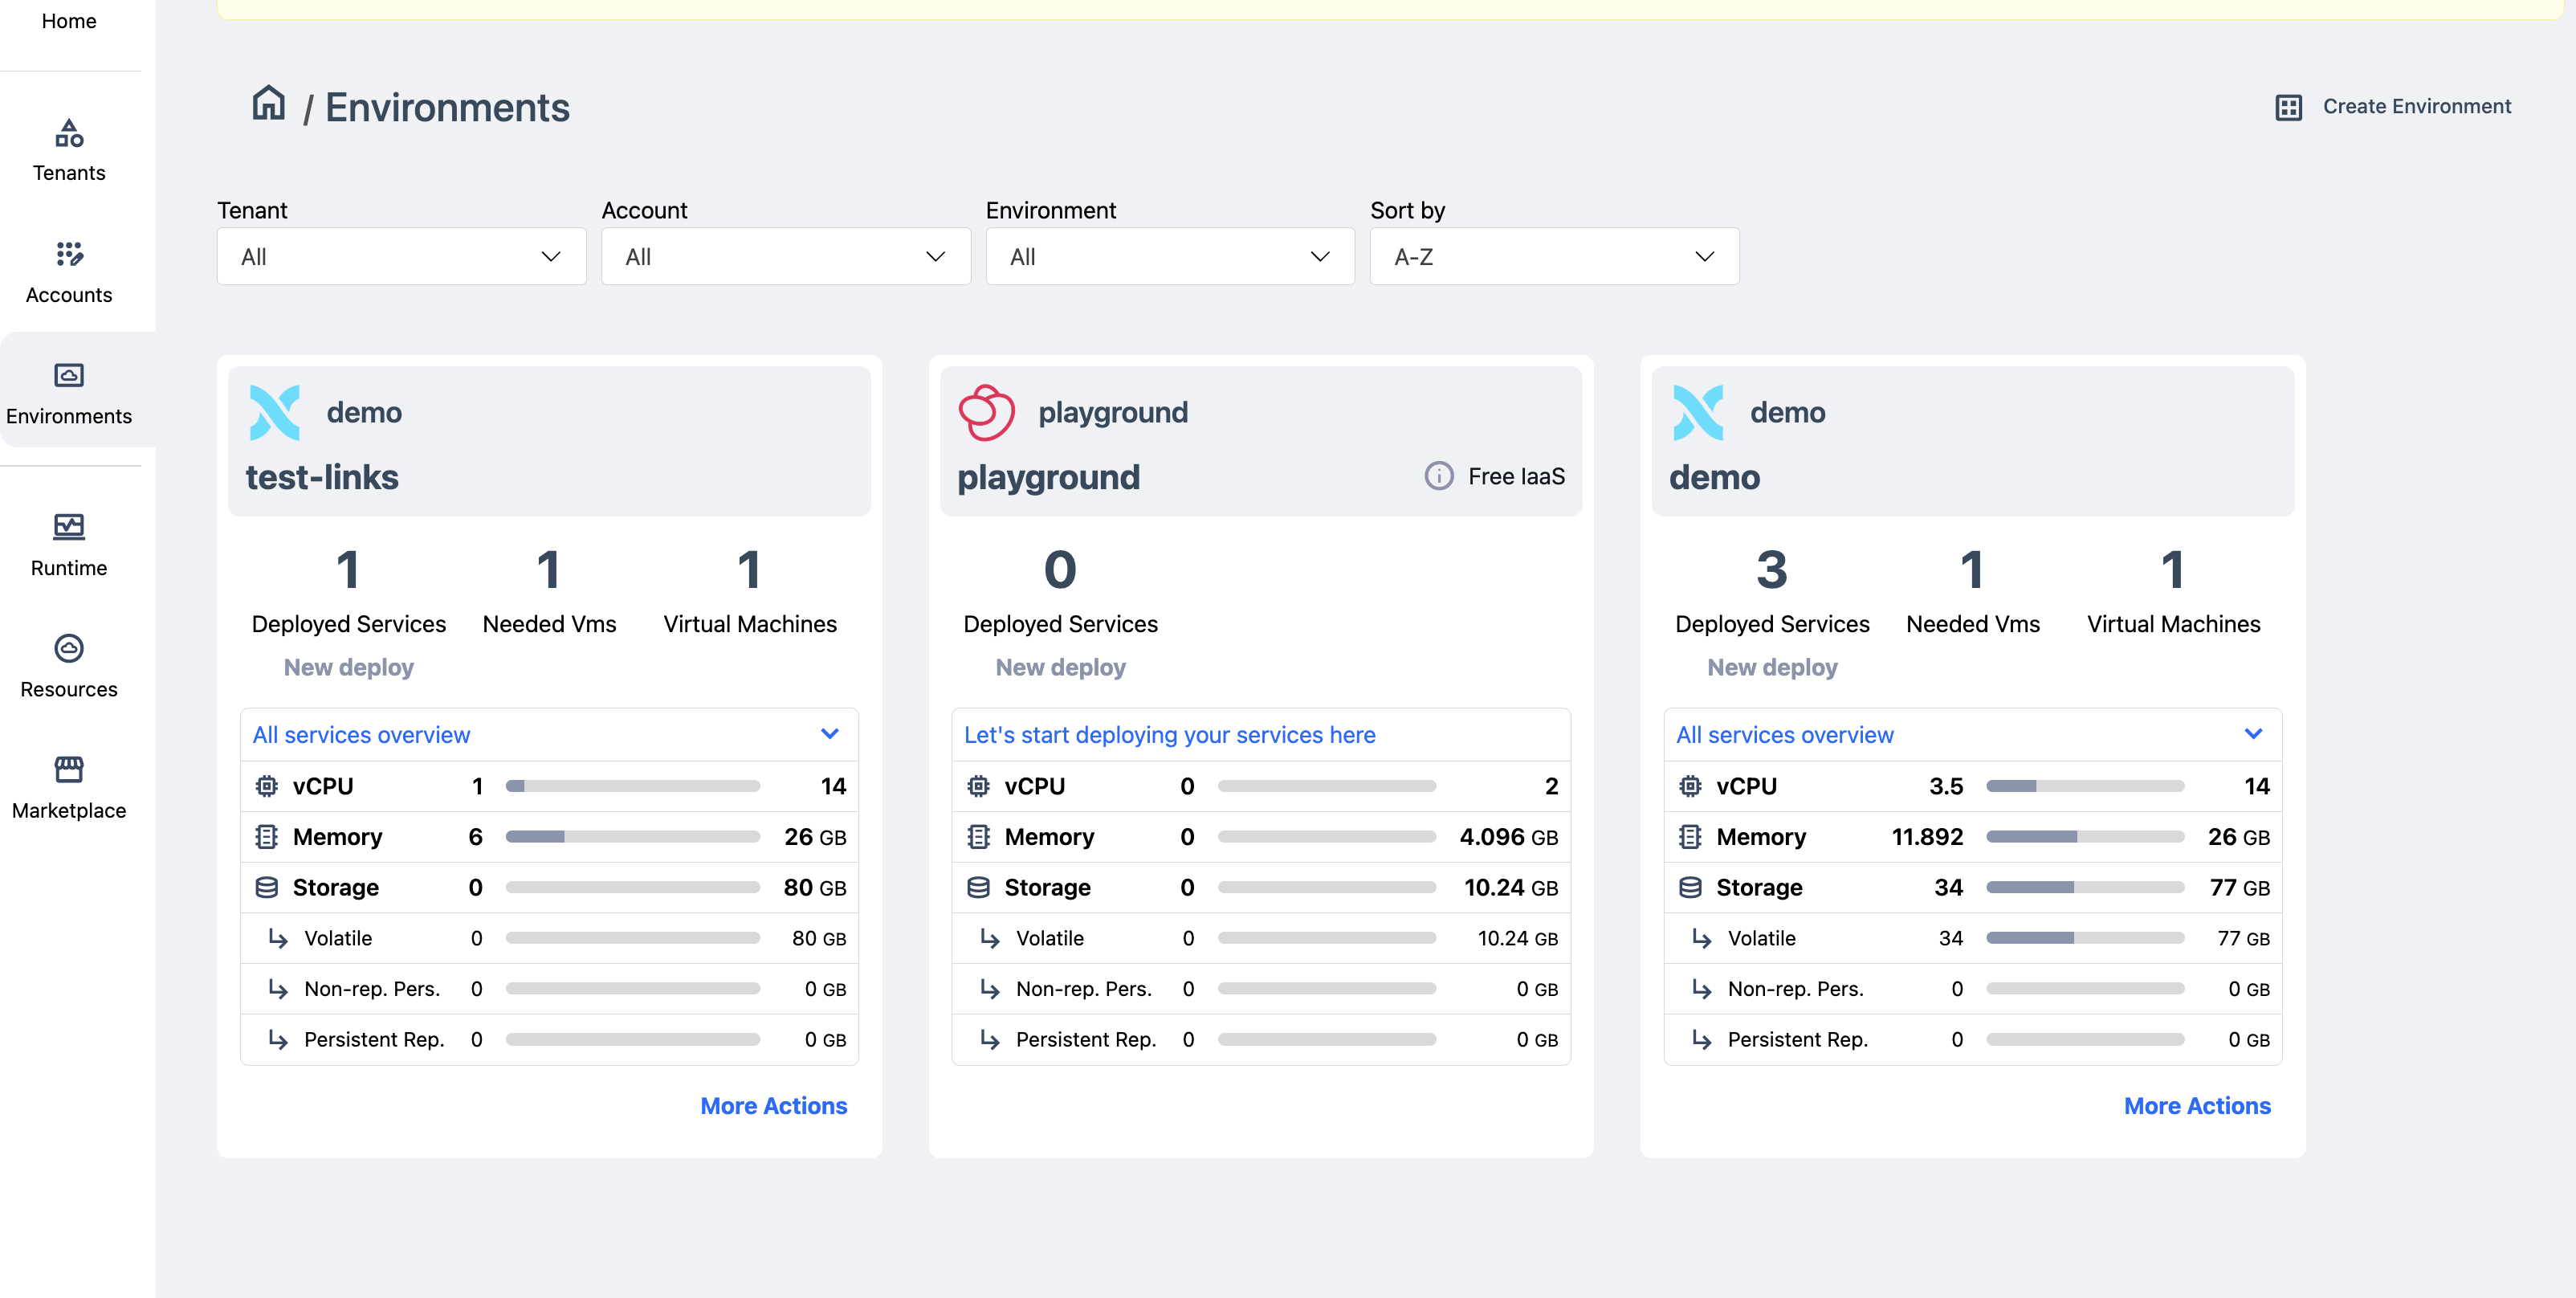
This dashboard is similar to the one for account management. Each environment is shown in its own card with a variety of information about resource consumption, services deployed, and VMs allocated to its cluster.
4.4.1 Environment edition
Similar to accounts, environments can be edited from the environment dashboard.
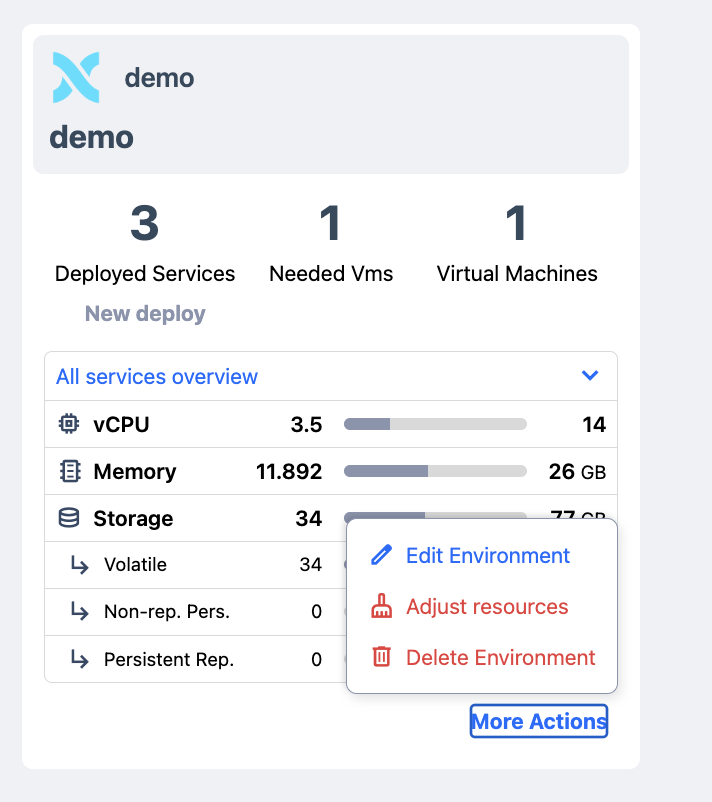
To edit an environment, just follow the link on its card (lower right corner) and select the edit action in the submenu
4.4.2 Adjusting environment cluster resources
In the environment card we can see three numbers near the top. To the left we find the total number of services deployed within the environment. To the right it shows us the number of worker VMs the cluster is using. At the center, we find the number of VMs Axebow determines are needed to run its current load.
When the number shown at the center differs from that shown to the right, it may be due to the fact that the cluster was scaled up at some point, but later on, the load decreased and now the load could run with less machines.
As explained above, Axebow scales the cluster up automatically, however it expects the user to manually ask it to scale down. This is done as scaling down the cluster has the potential to temporarily disrupt some of the services deployed on it. Thus no automatic action to downsize the cluster is taken. Instead, the user is given the possibility to manually adjust the size of the cluster choosing the “Adjust Resources” submenu, also at the bottom right corner of the environment card.
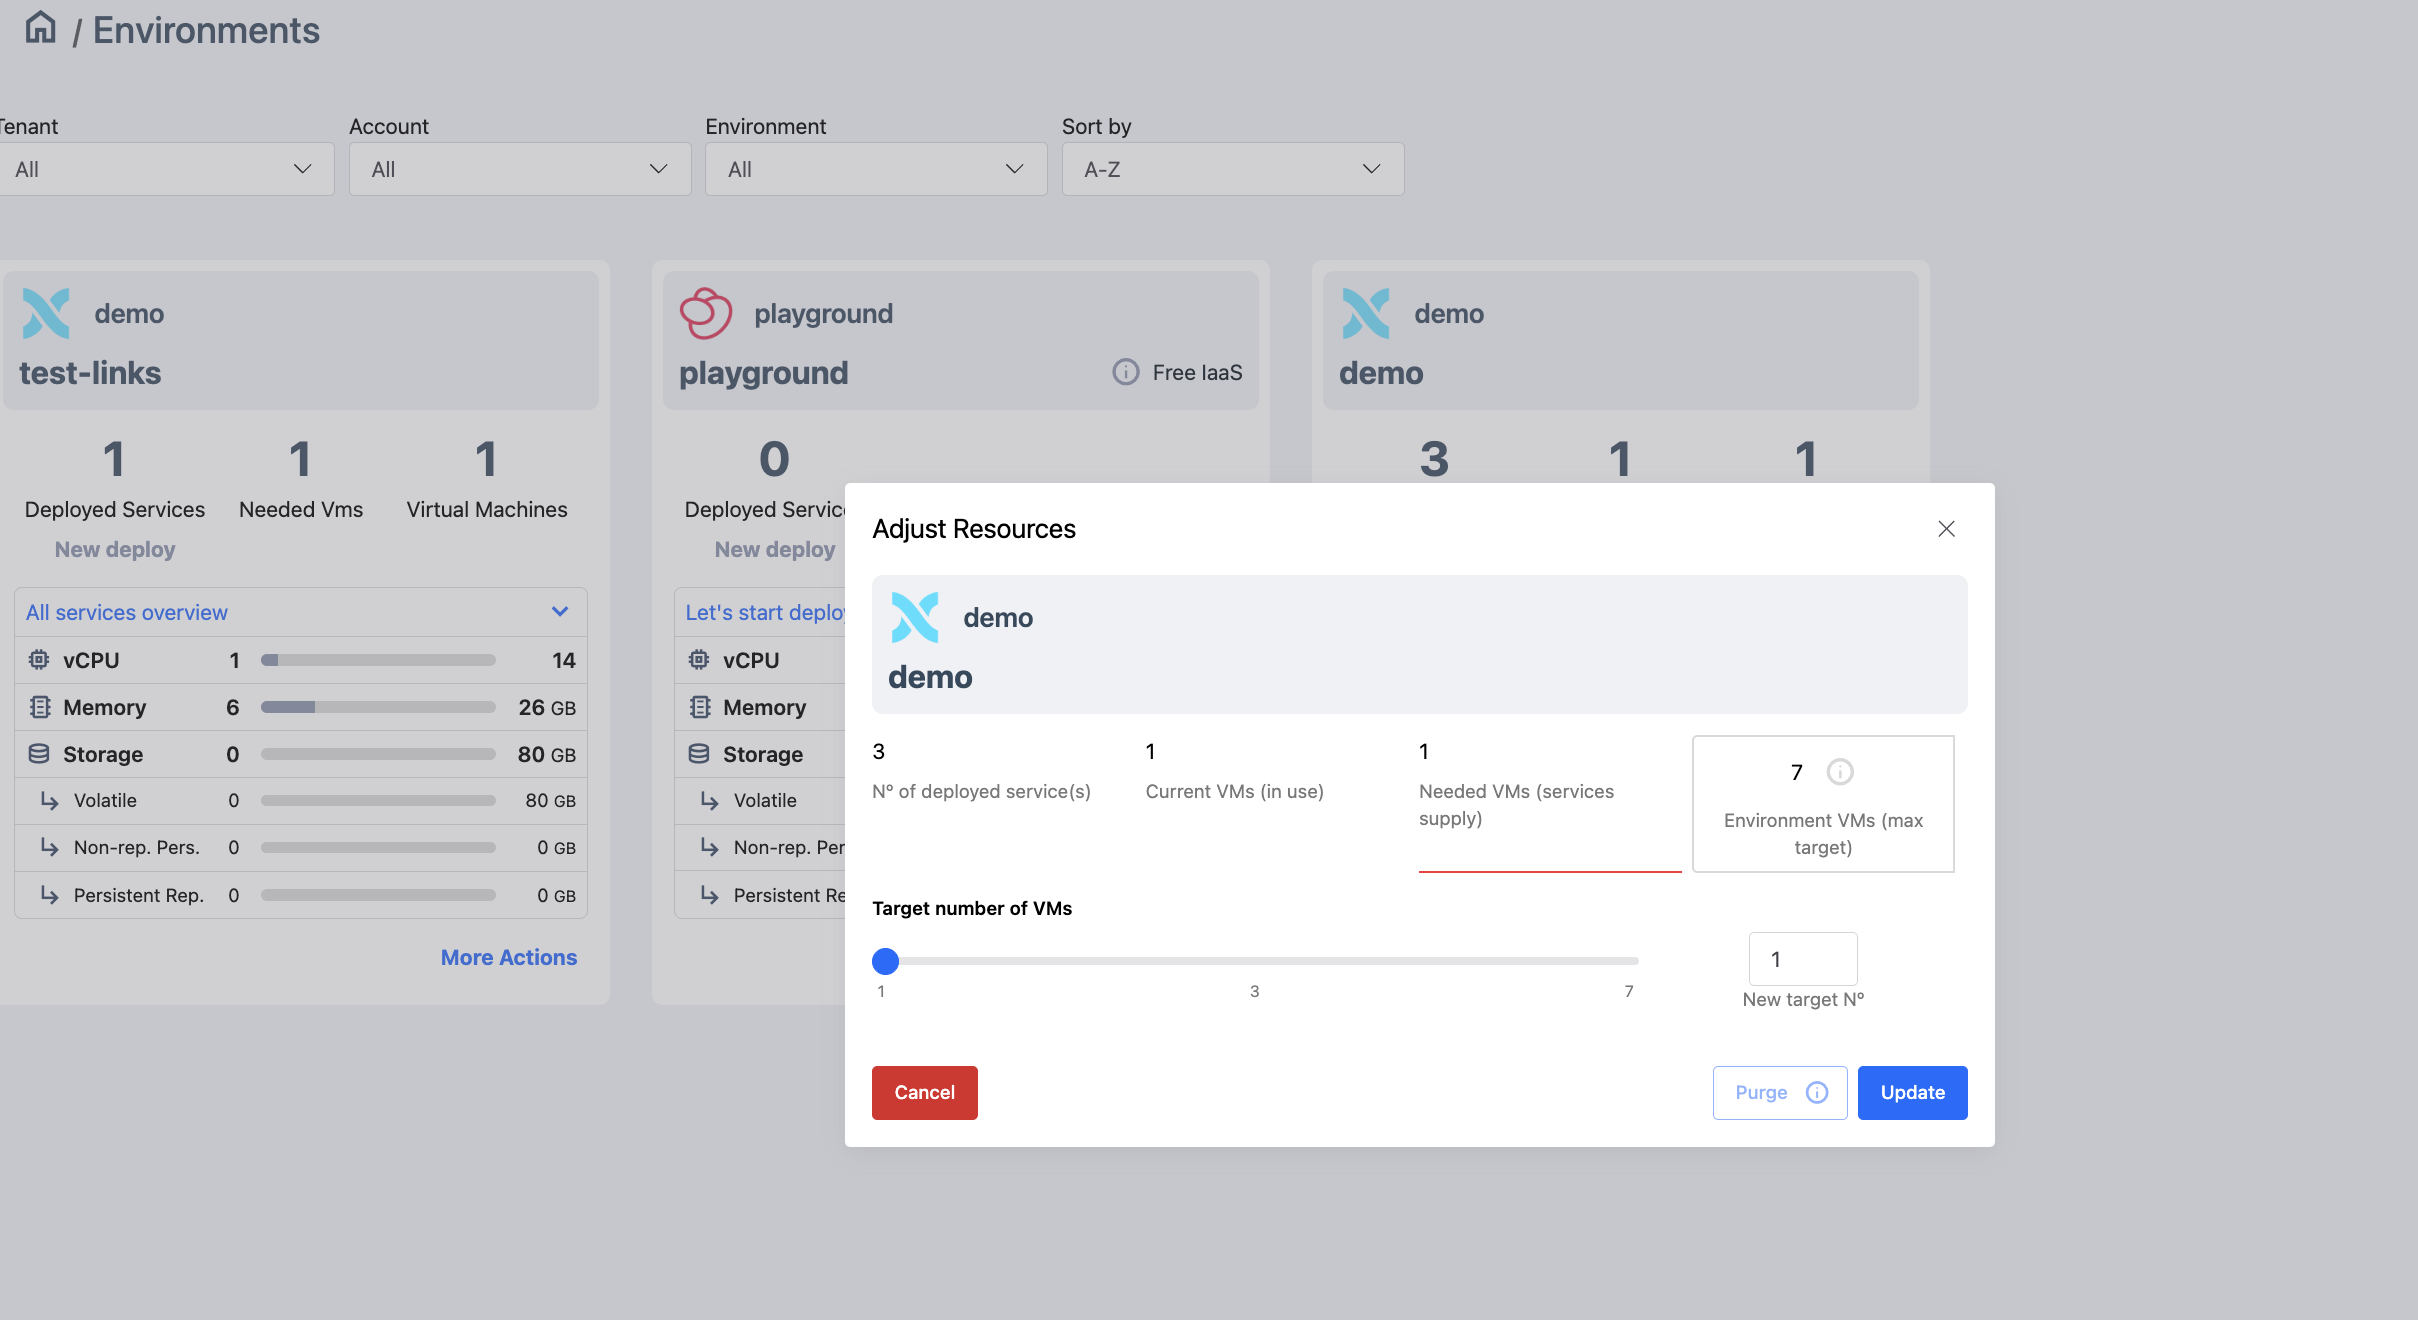
The form that pops up when selecting the action lets us modify the number of worker VMs in the cluster.
In addition, if no services run in the cluster, we can choose to purge the environment, action that effectively will release all resources assigned to the cluster.
5 Deploy Services
To deploy a service in Axebow, the user can start the flow from any of the following entry points:
- “Deploy my first service” link in the onboarding section of the Home dashboard
- “Deploy Service” link within the Quick Actions menu in the header (located in the top-left area of the interface)
- “Deploy Service” link available in the Runtime dashboard
The service deployment flow consists of four steps, presented in a sequential and guided manner. Each step is described below.
Step 1: Service identification
In the first step, the user must identify the service by completing the following mandatory fields:
- Service name
- Container registry from which the image is pulled
- Name of the image to be deployed
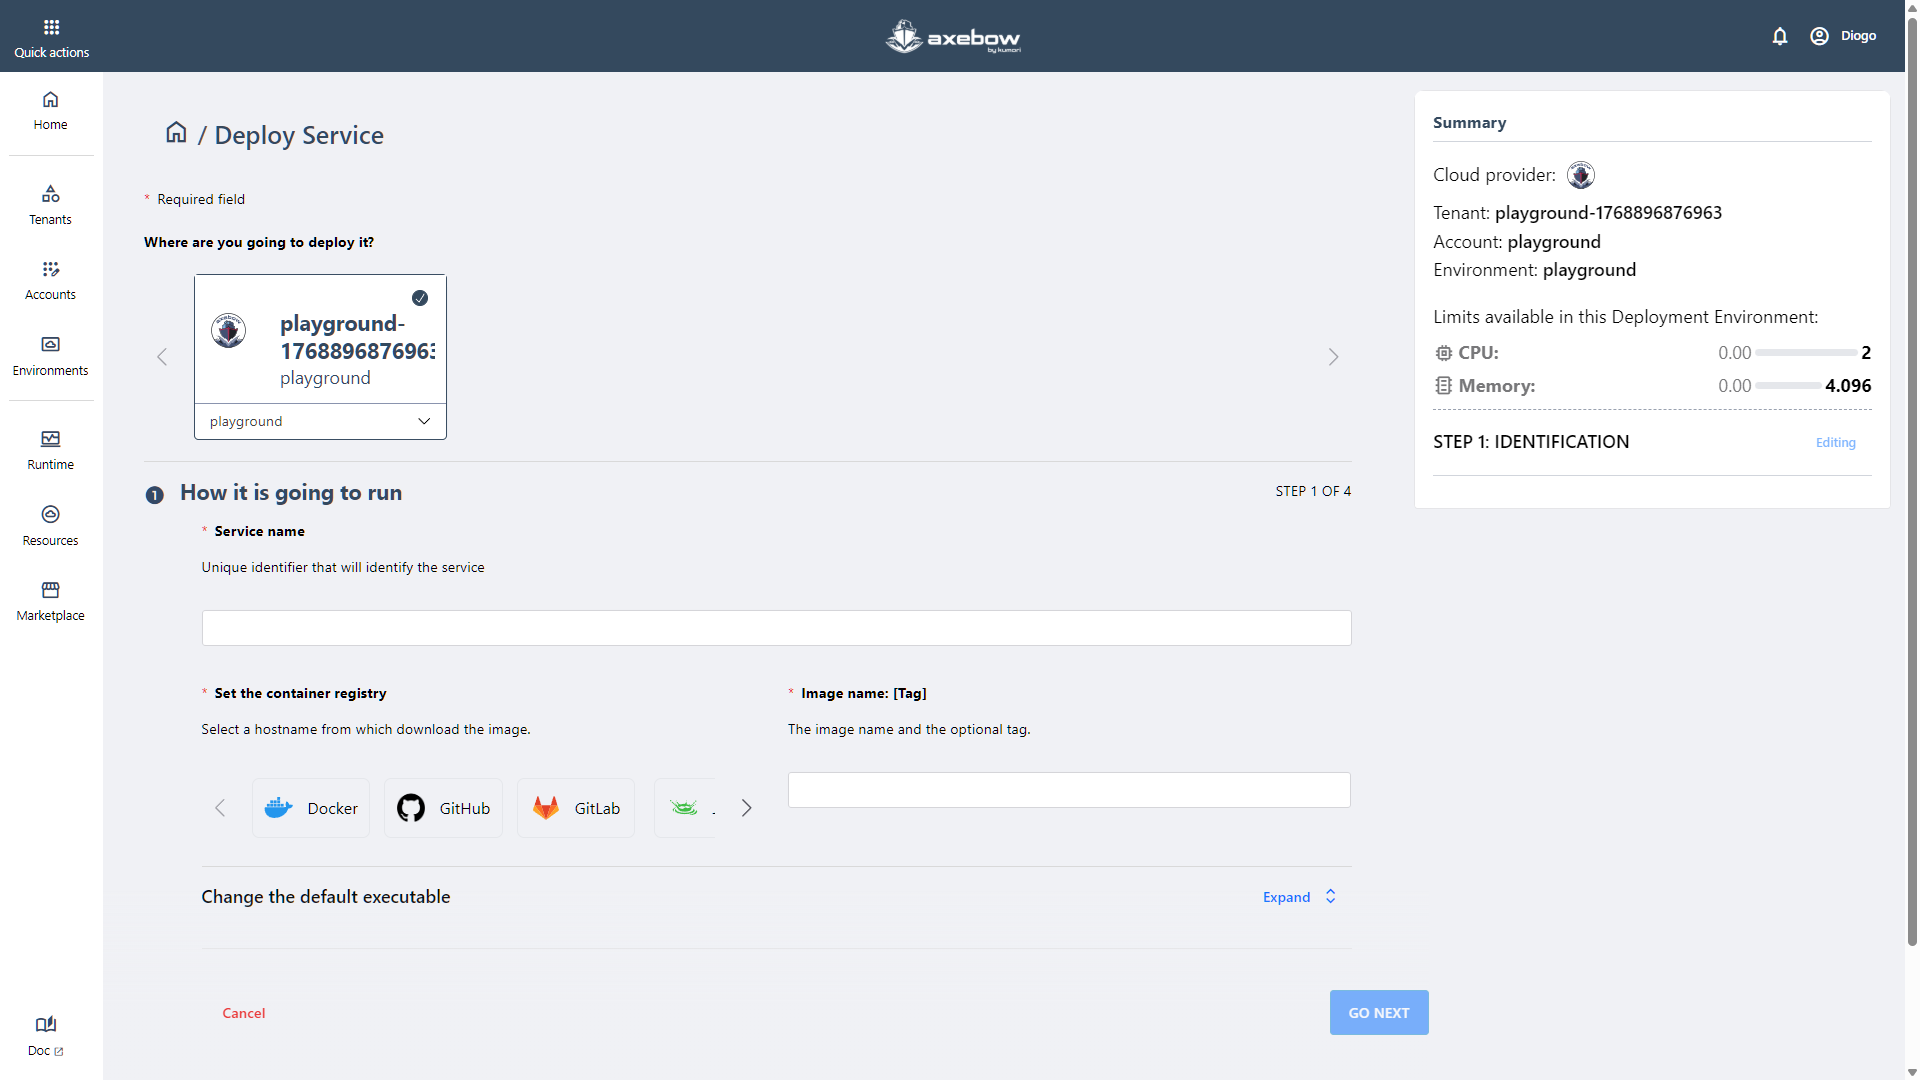
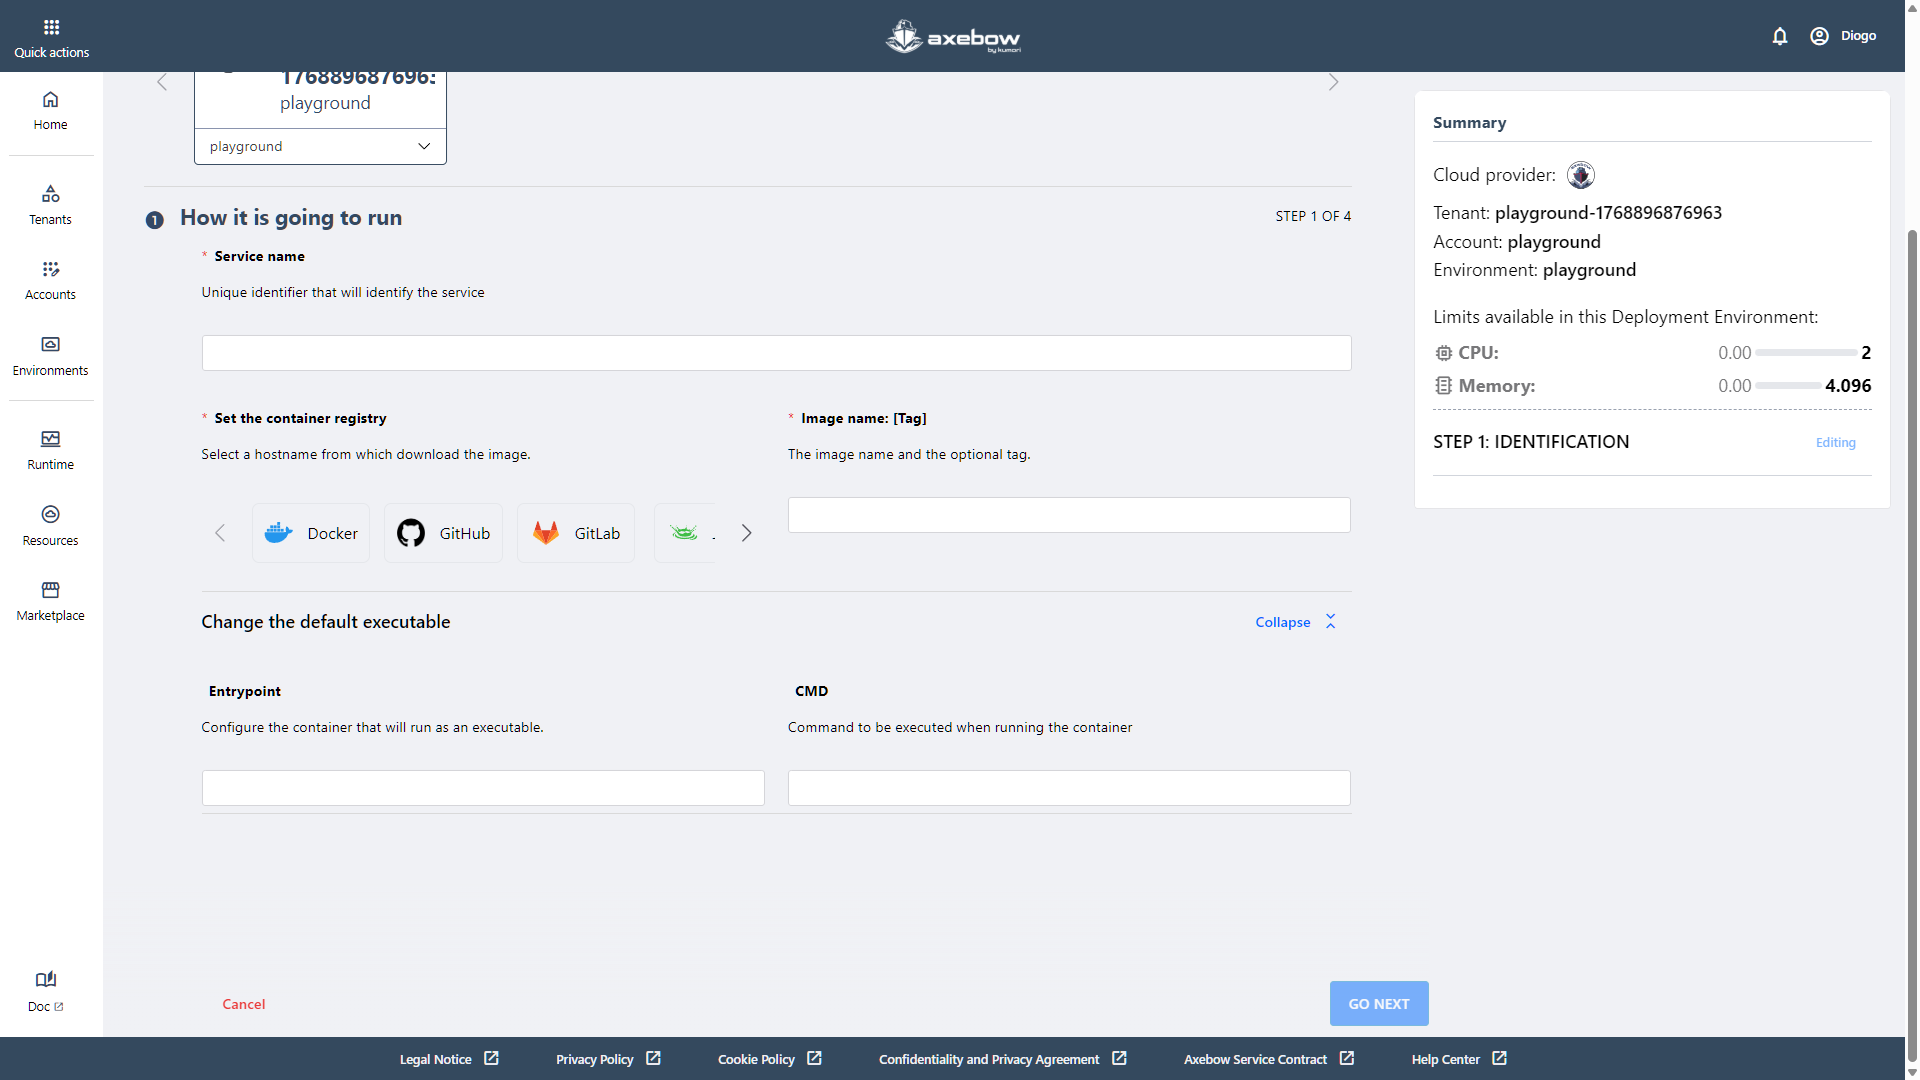
Optionally, the user can modify the image’s default executable. To do so, the user must expand the “Change the default executable” section, where the entry point and execution command can be defined.
This section is optional and, for that reason, appears collapsed by default in the UI.
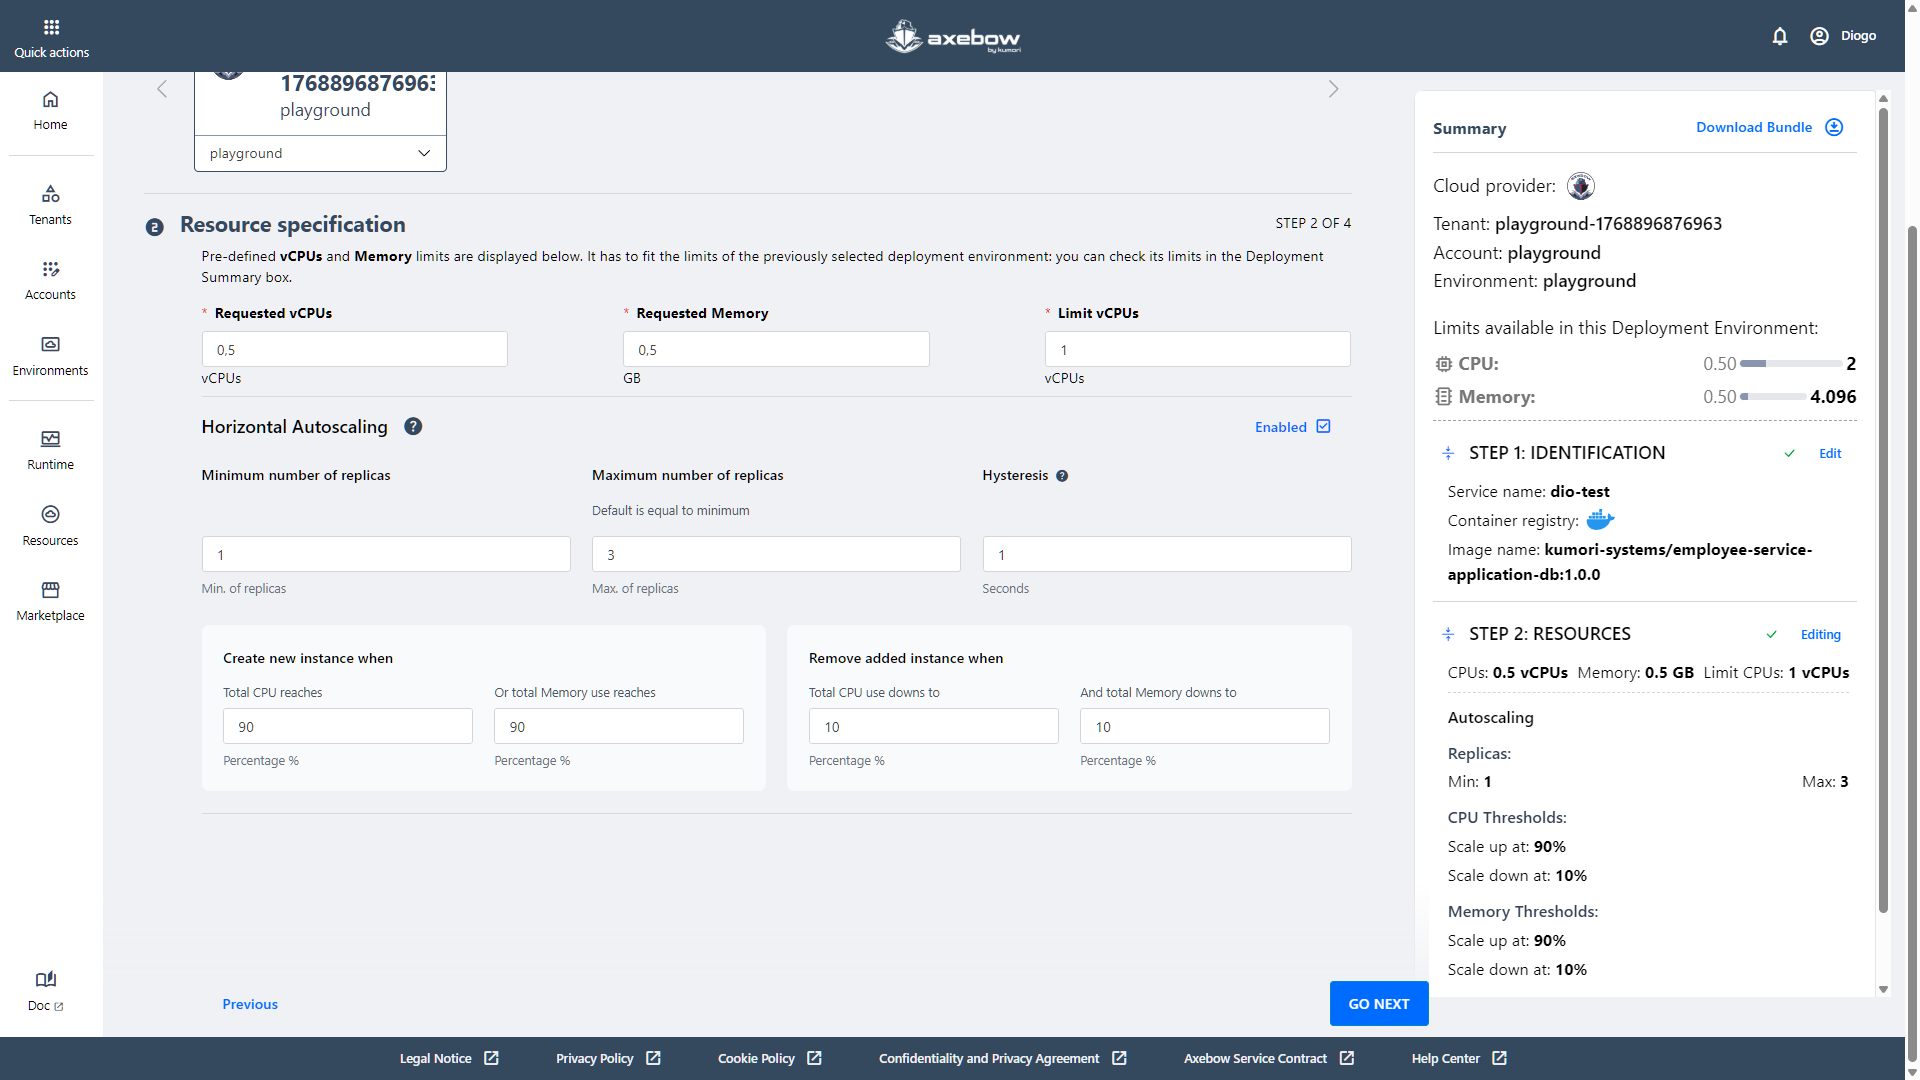
Step 2: Resource specification
In the second step, the user defines the resources required to run the service, such as CPU and memory.
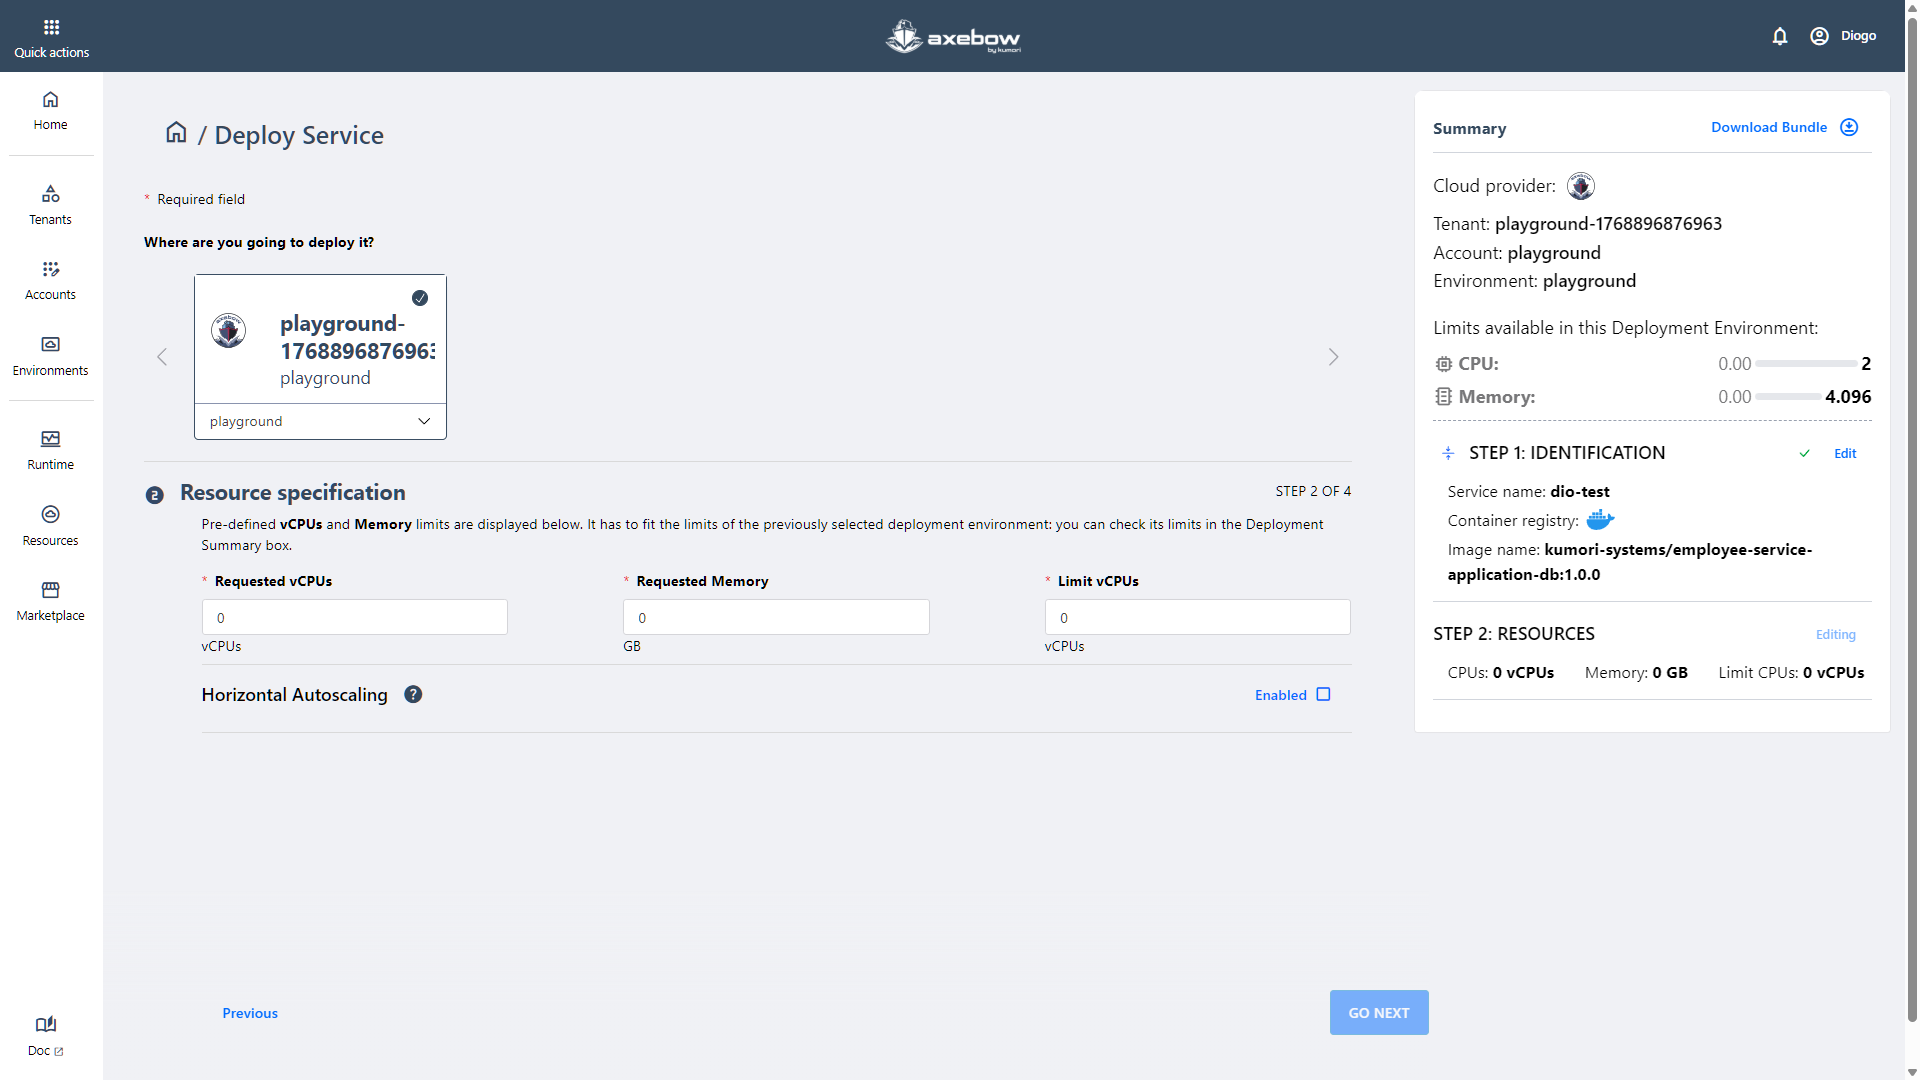
Additionally, the user can enable horizontal scaling if desired.
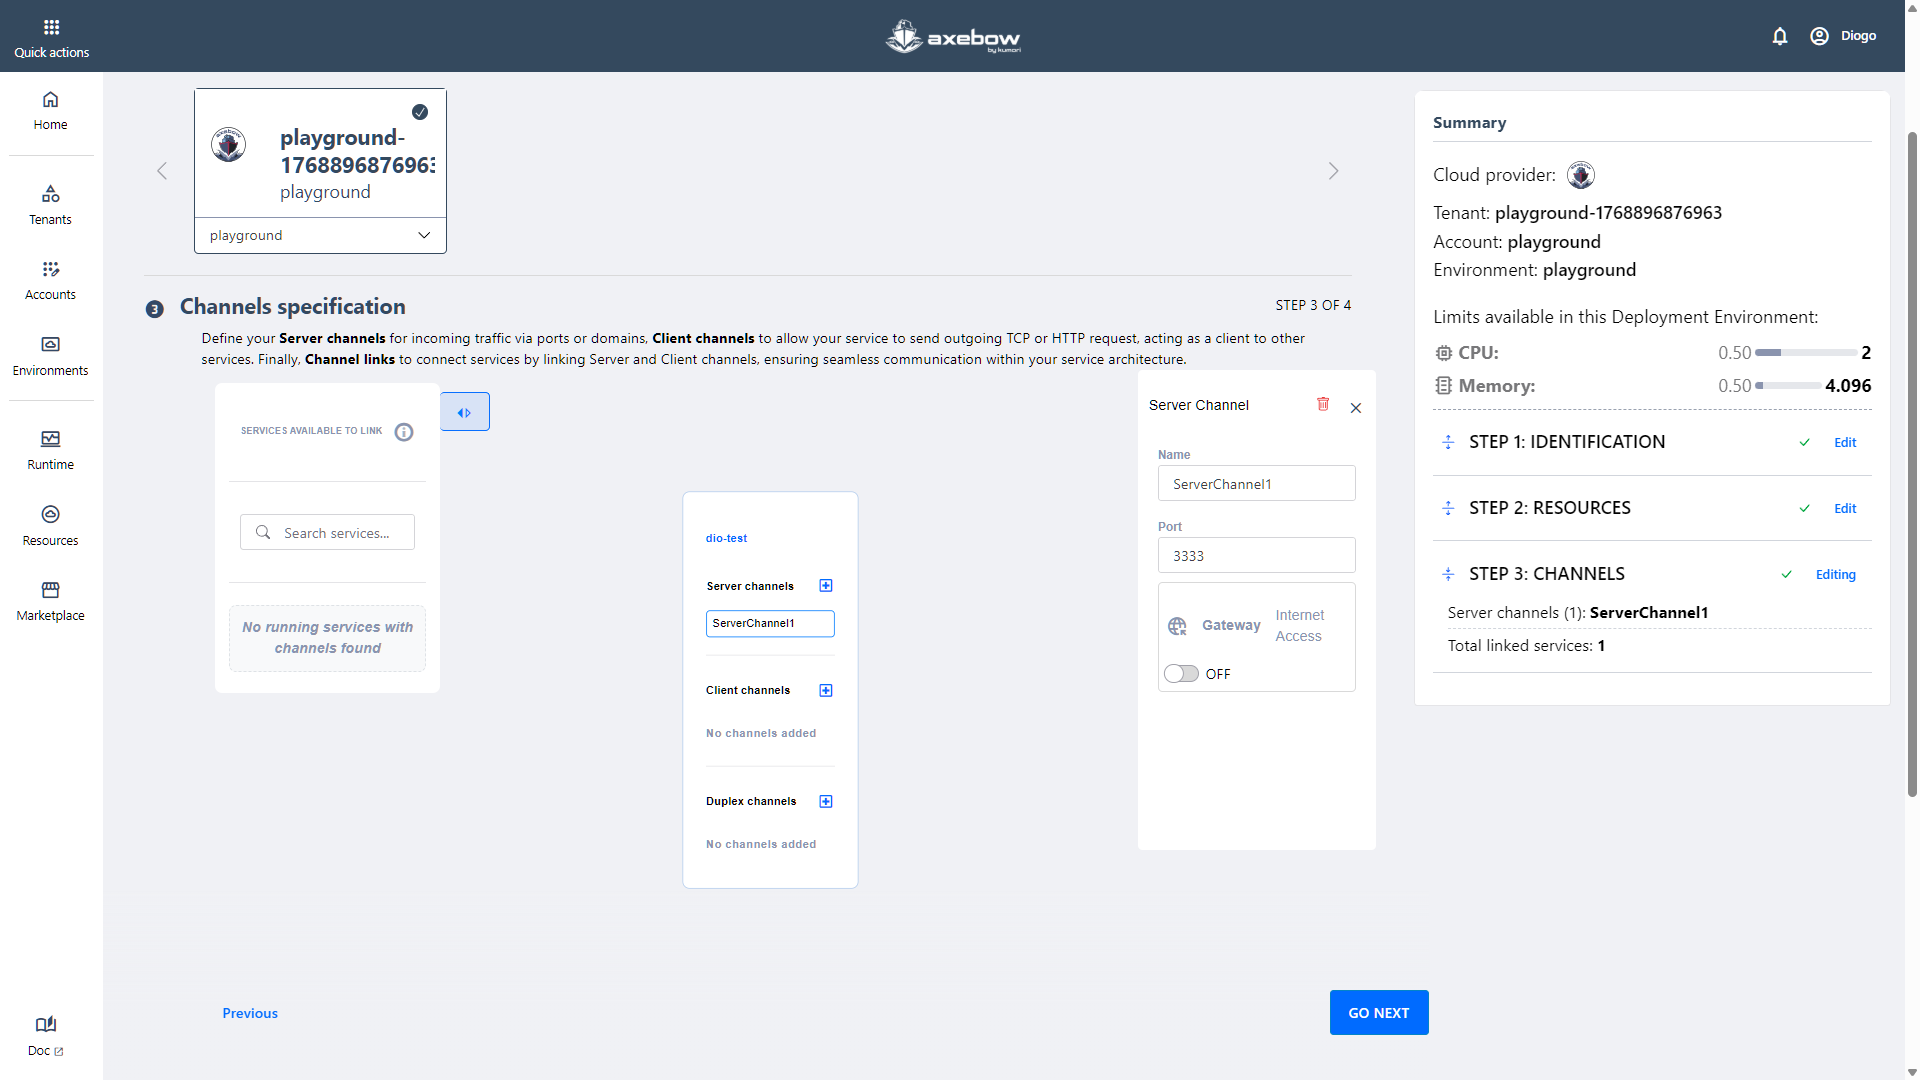
Step 3: Channel specification
In this step, the user can link the service being configured with other services previously deployed within the same Tenant.
The image below shows a scenario where no other services are currently available for linking. This may occur because it is the first service deployed in Axebow or because there are no services available in the selected infrastructure.

This step does not require any mandatory input.
Even if service linking is not performed at this stage, the user can still configure the service’s channels in preparation for future integrations.
In this step, it is possible to create:
- Server Channels
- Client Channels
- Duplex Channels
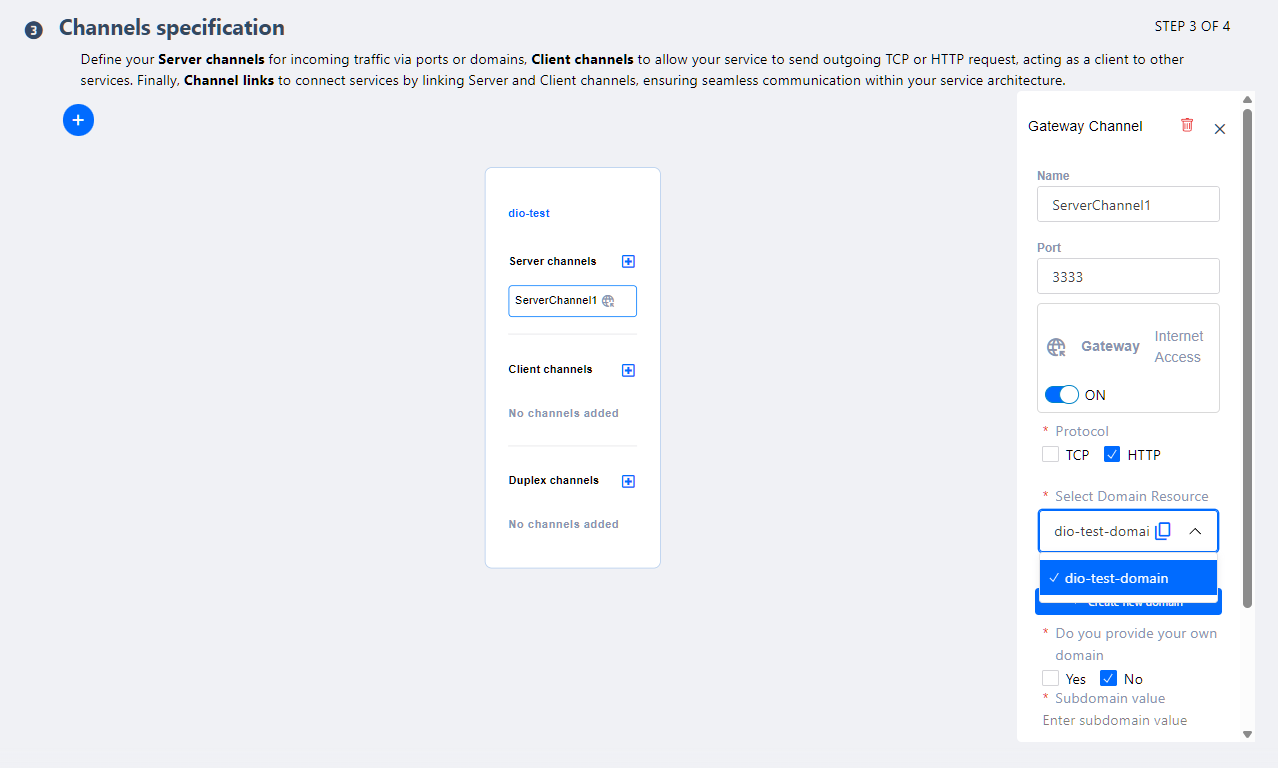
A Server Channel can allow access from the Internet or remain restricted. To enable external access, the Gateway toggle must be activated.
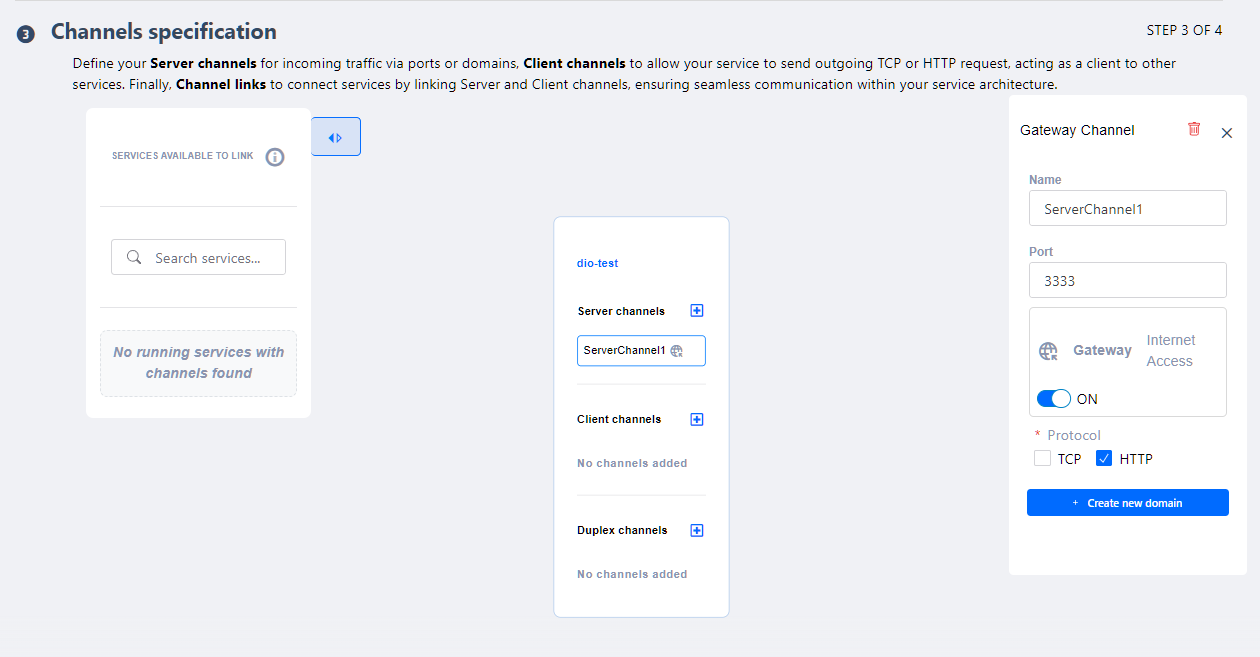
At this point, the user can:
Create an Axebow subdomain by defining a valid subdomain name.
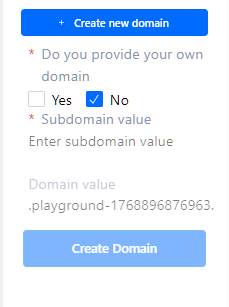
Axebow subdomain creation … Or use a custom domain, adding the corresponding certificates to the platform.
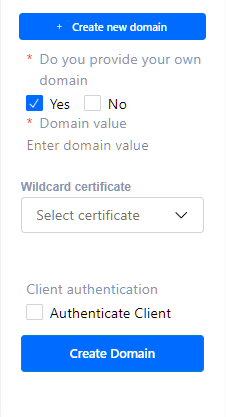
Custom domain creation
If the user already has domains configured within their Axebow infrastructure, a dropdown selector will be displayed to choose an existing one.
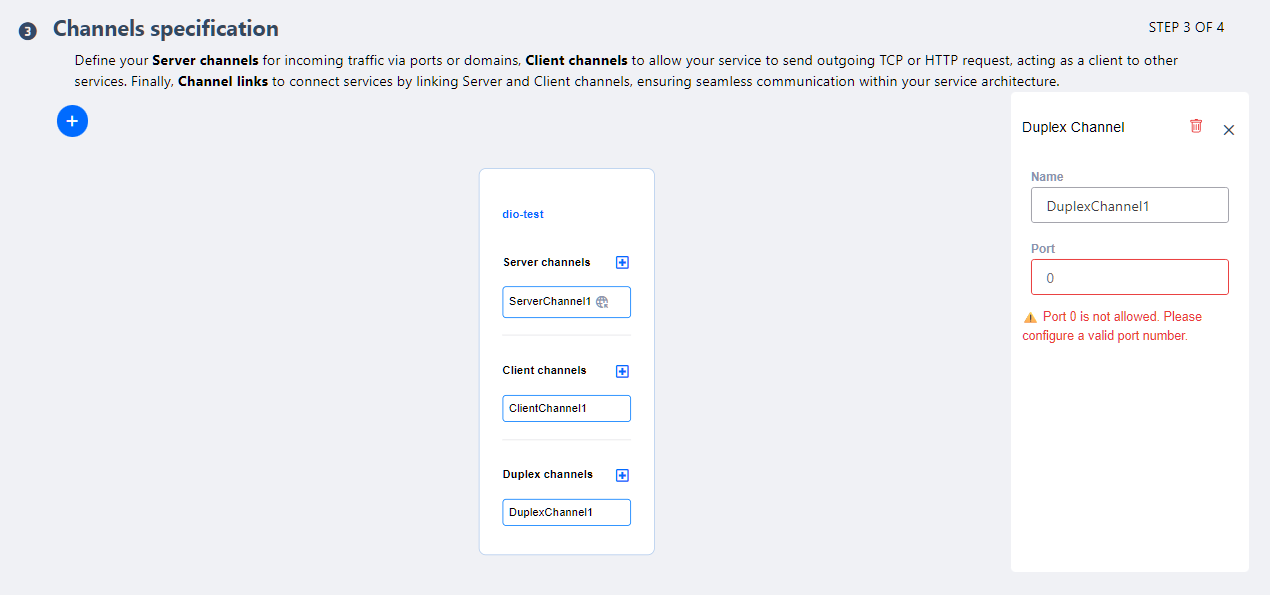
To create Client Channels, only a name is required.

For Duplex Channels, both a name and a port must be defined.
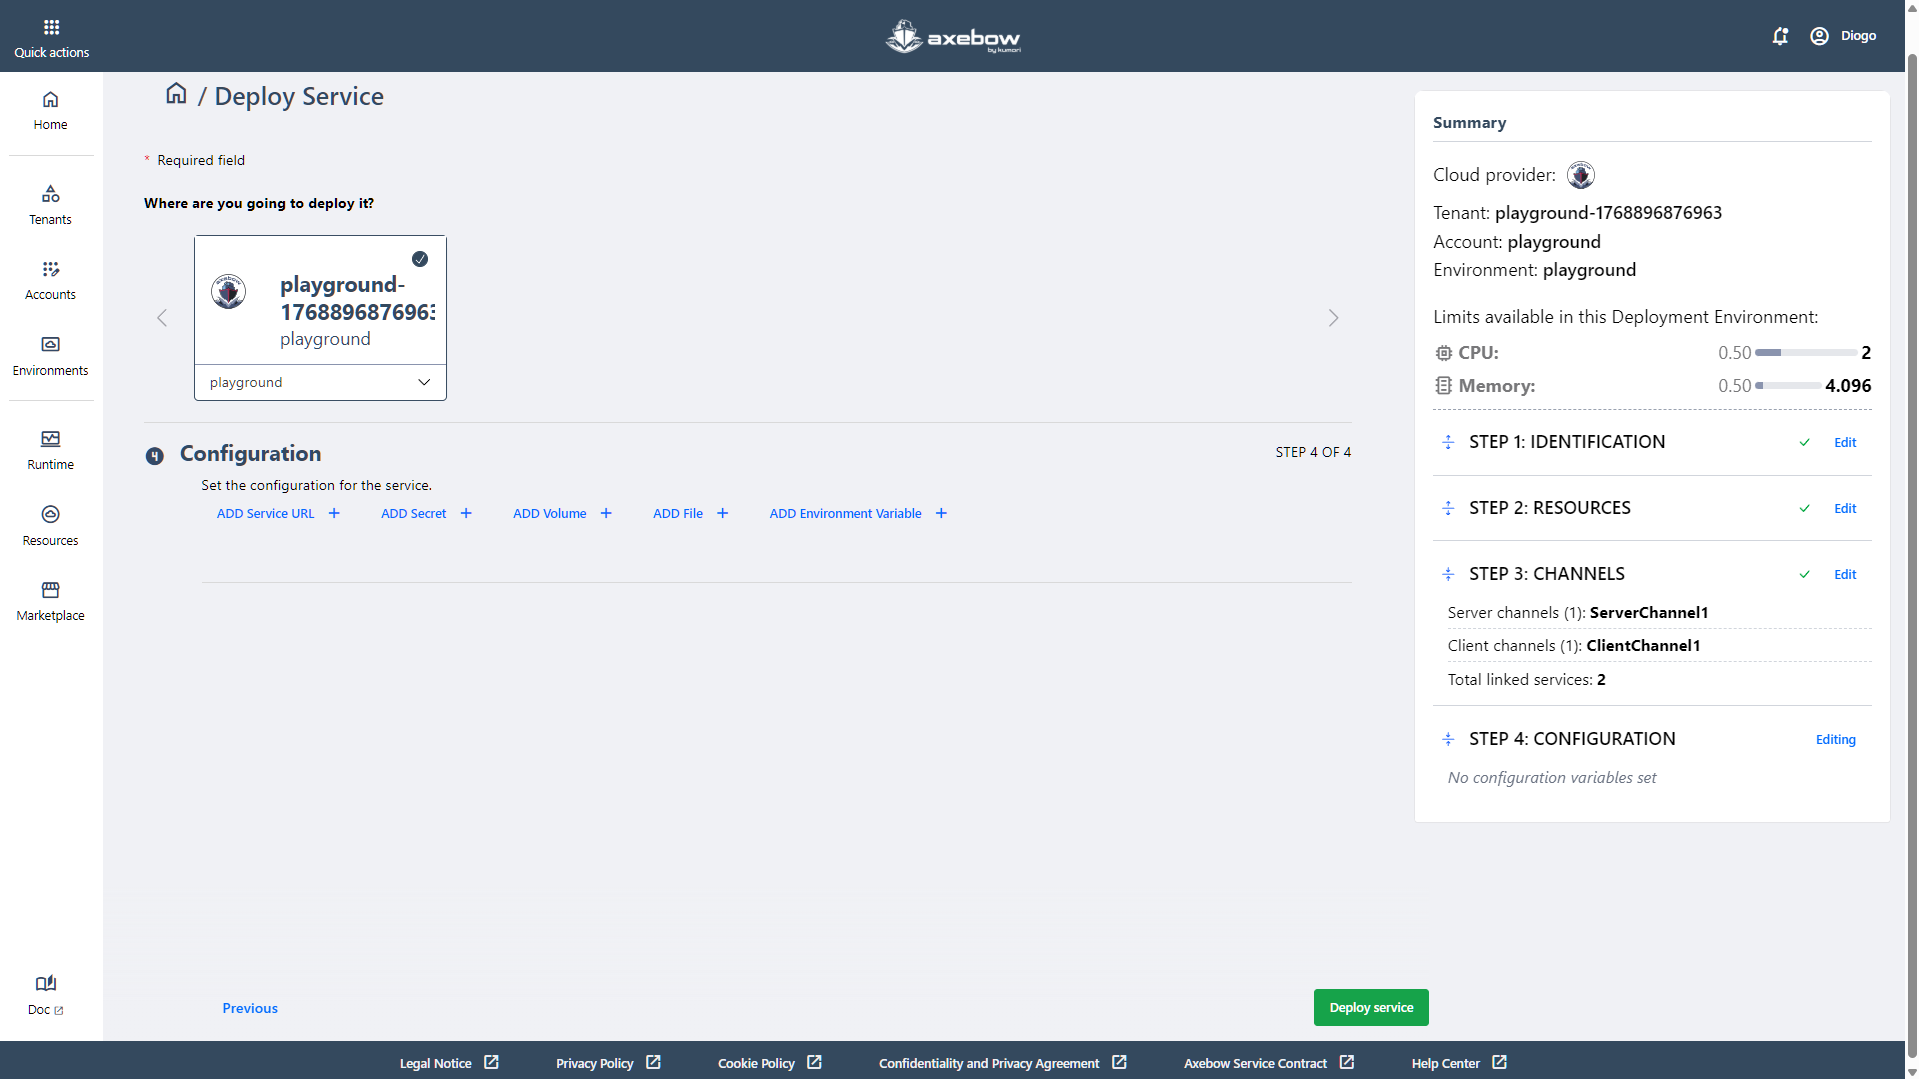
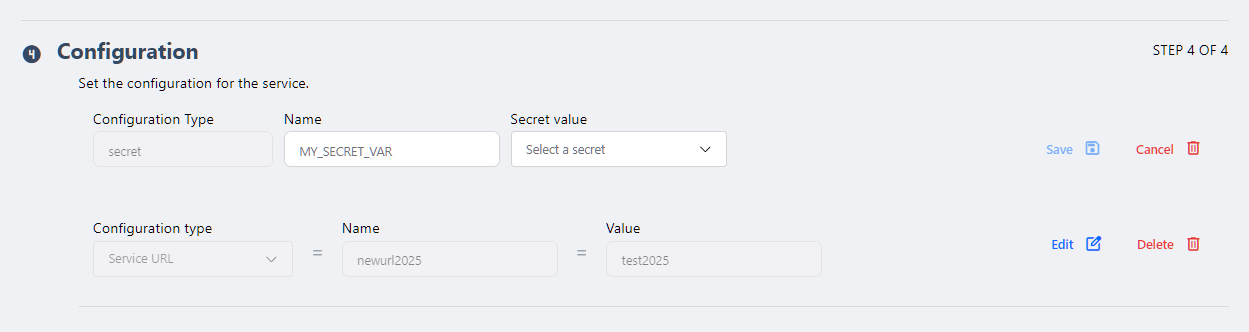
Step 4: Configuration of parameters and environment variables
In the fourth and final step of the flow, the user can define the service configuration and environment variables.
At this stage, the user can:
- Add service URLs
- Create or select secrets
- Define volumes
- Add environment variables
- Upload files related to the deployment
This step is also optional, and its usage depends on the specific needs of the service being deployed. The available options of configurations are described below.
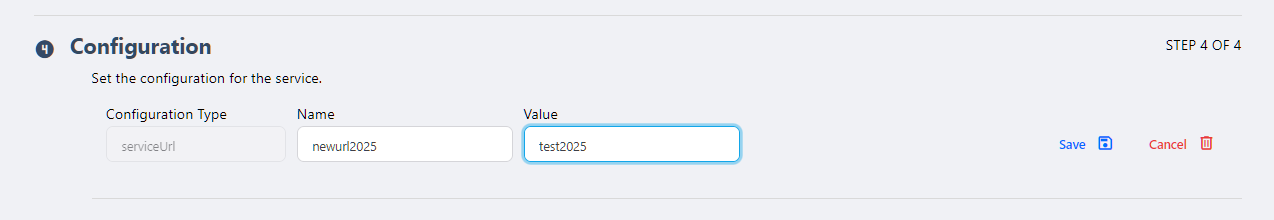
- Add service URL
- The form must be completed correctly for the Save button to be enabled and for the configuration to be applied to the service.
- Add secret
- Allows the user to create new secrets or select previously created ones.
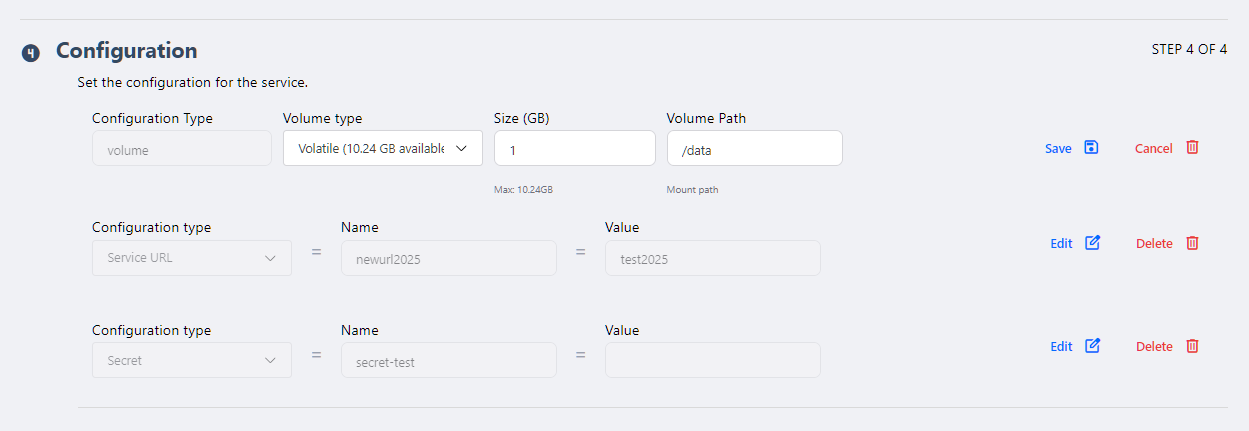
- Add volume
- Currently, the platform only allows adding Volatile volumes to deployed services. The user must define the volume size in GB and its path.
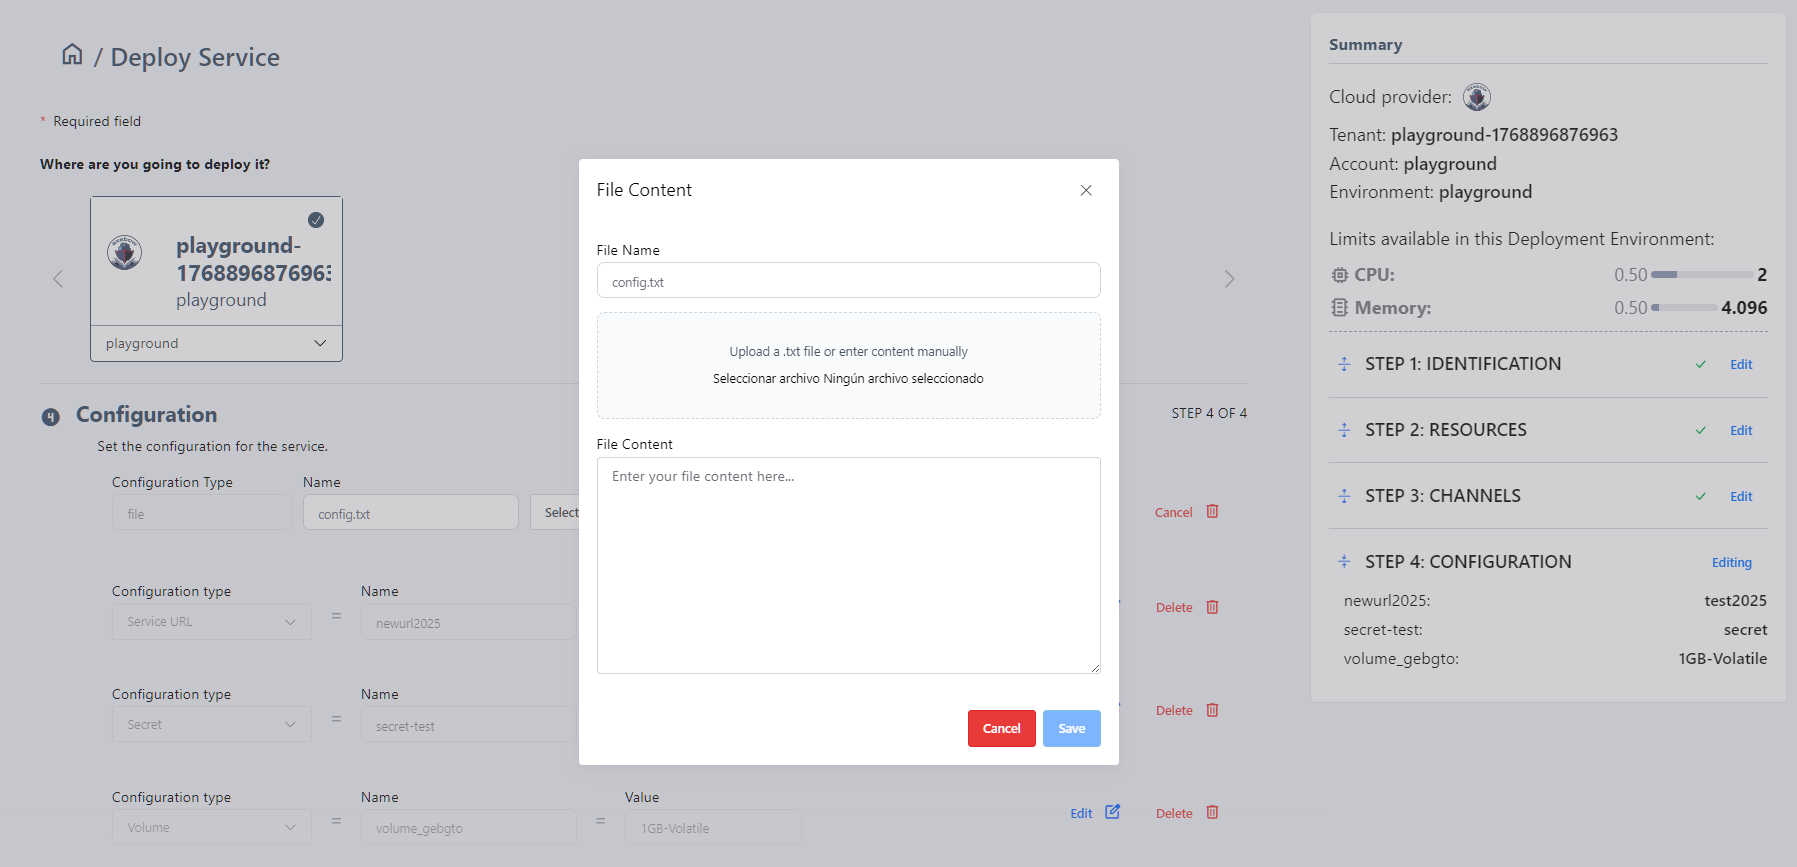
- Add file :
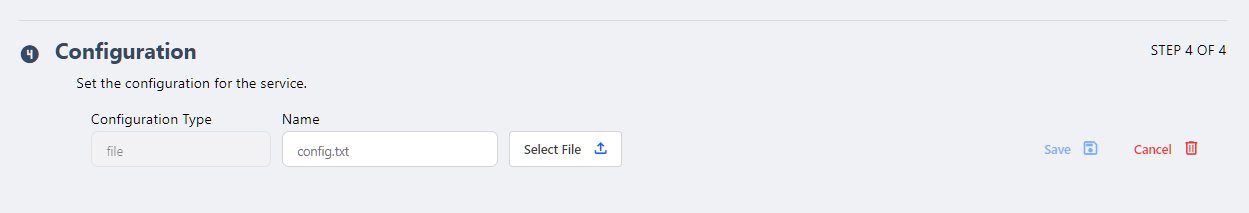
To add a file, the user has two options:
- Select a file from their device (in .TXT format) and upload it to the platform.
- Write the content directly in the modal provided by the platform (¿¿also accessible via the Copy: Select file action??). → el CTA deberia ser Write/upload it
- Add environment variable
- Currently, the platform only allows adding Volatile volumes to deployed services. The user must define the volume size in GB and its path.
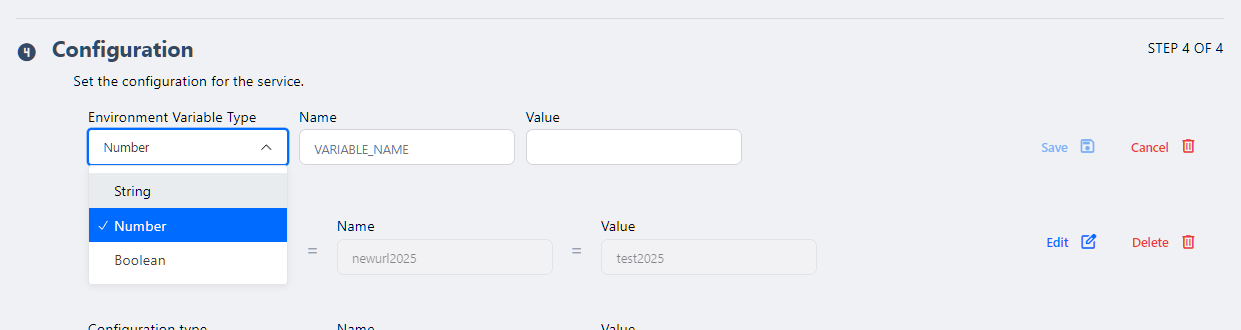
The configuration flow for Strings, Numbers, and Booleans follows a similar pattern, with the form adapting to the required data type.
Once the desired configuration is completed, the user clicks the “Deploy Service” CTA. Before executing the deployment, the system validates all defined attributes.
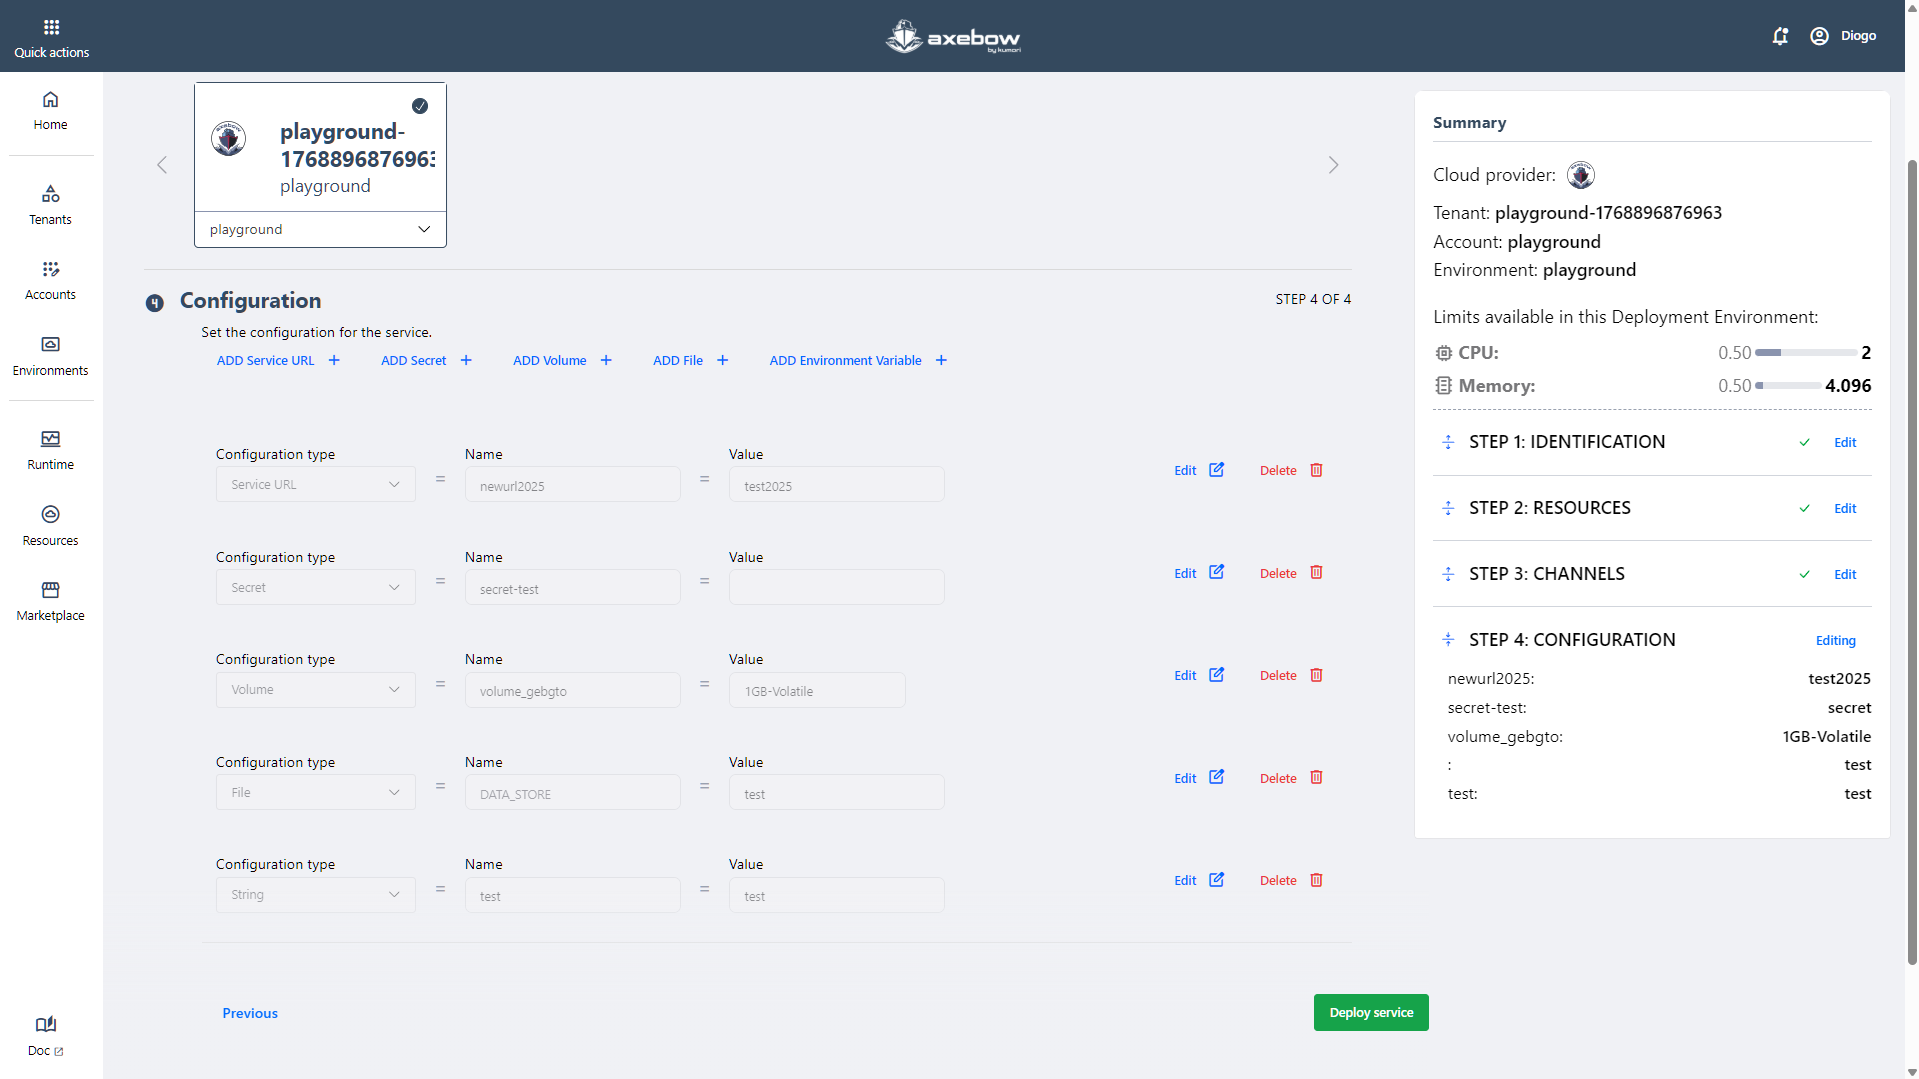
After a successful deployment, the user is redirected to the Runtime Dashboard, where the service card will appear in a running state.
If any inconsistency is detected when clicking “Deploy Service”, the error will be automatically displayed in the Summary panel, allowing the user to quickly correct it before attempting deployment again.
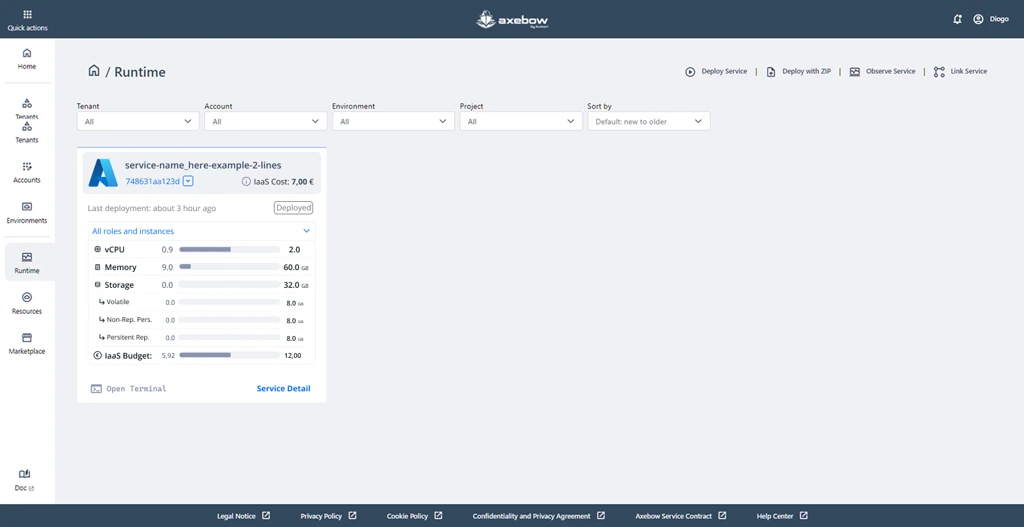
6 The Runtime Dashboard
The Runtime Dashboard is the space from which users can view, monitor, and operate the services deployed in Axebow. This view presents a list of running services, organized through filters by Tenant, Account, Environment, and Project, making it easier to manage even complex or large-scale infrastructures.
Each service card displays key real-time information, such as the deployment status, the date of the last deployment, the estimated IaaS cost (when the service belongs to a paid infrastructure), and resource consumption — vCPU, memory, and storage.
From this dashboard, users can quickly access common operational actions, such as opening a terminal for a running service, viewing service details, or starting core workflows like Deploy Service, Deploy with ZIP, Observe Service, and Link Service.
Overall, the Runtime Dashboard acts as the operational control center for services, providing immediate visibility into system status and direct access to the most relevant actions for day-to-day management.
7 Deploying services with bundles (.ZIP archives)
Bundles are zip archives containing a group of kdsl modules, with one specific module containing a deployment specification.
Deploying bundles through the web interface serves as a way to quickly test specifications of more conplex service applications, while possibly preparing them for inclussion in a CI/CD pipeline.
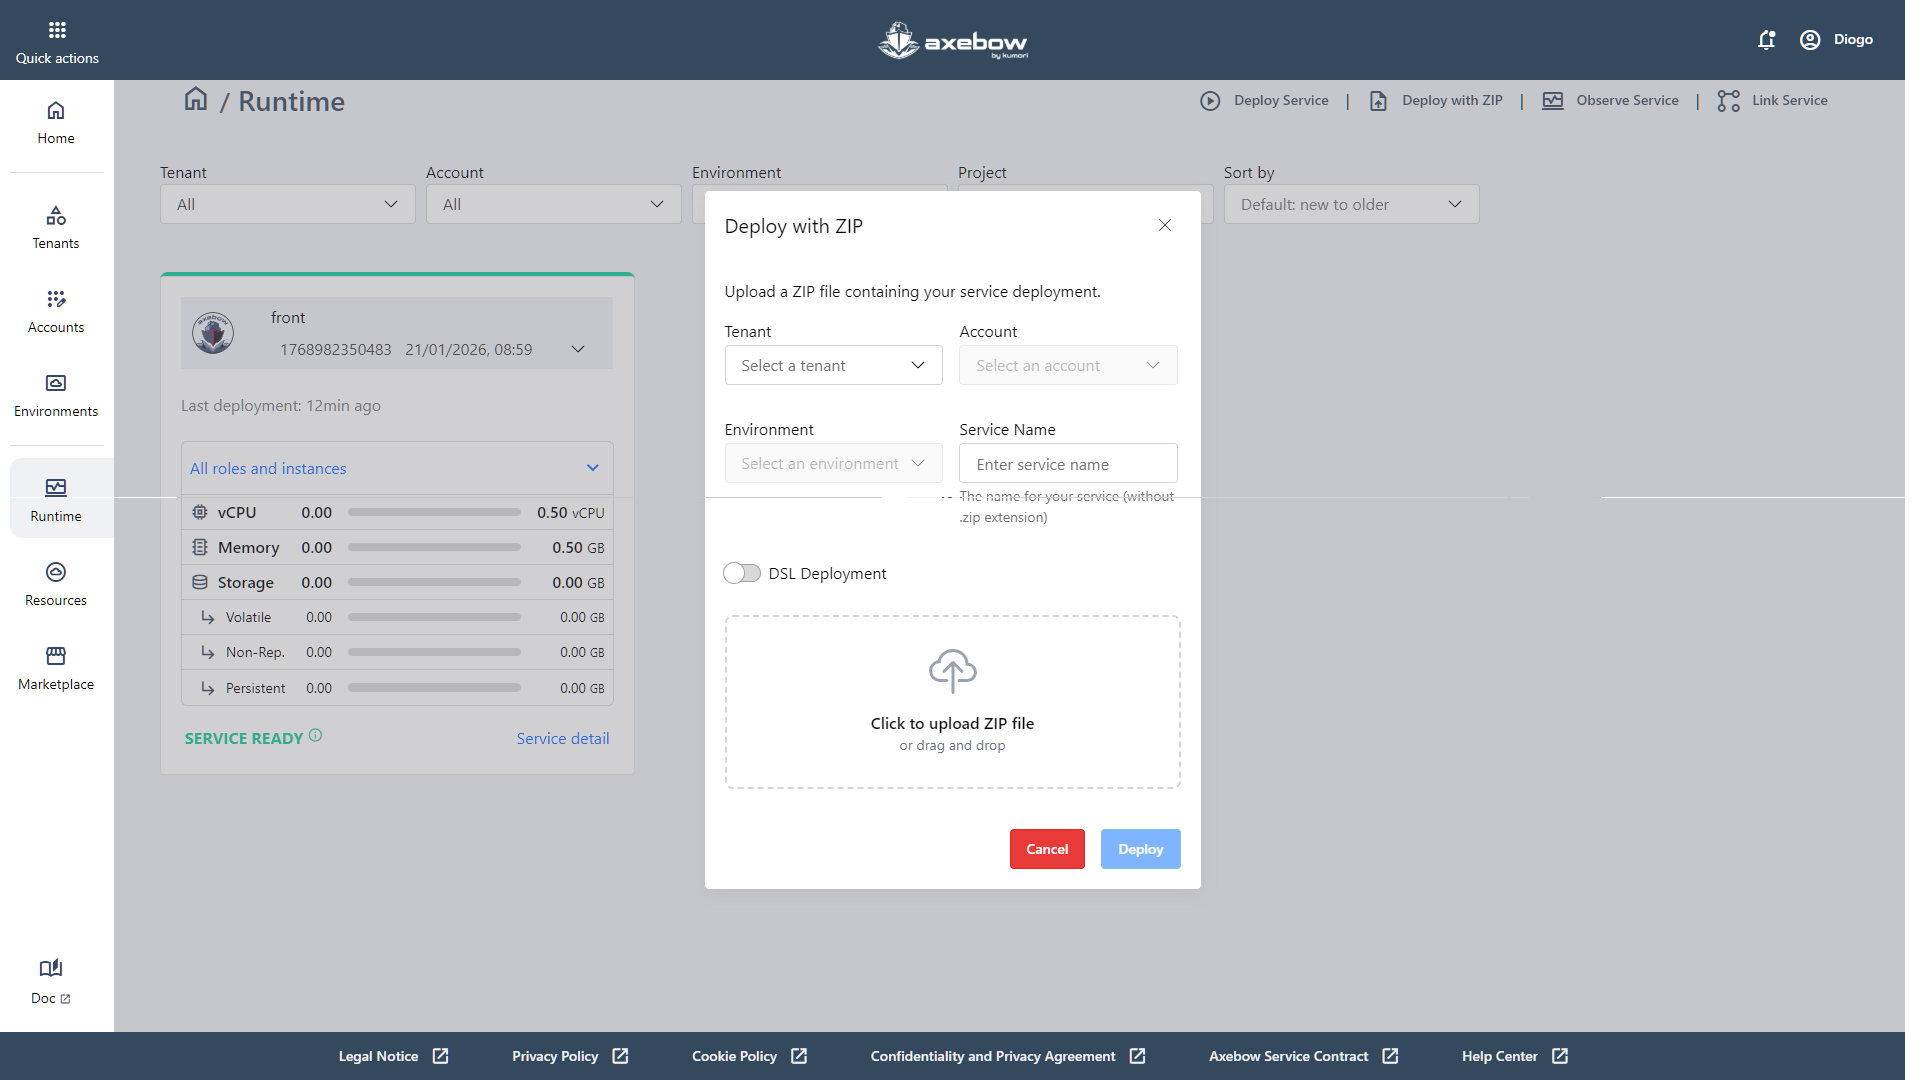
The “Deploy with ZIP” link opens a modal that allows the user to deploy a service in Axebow using a .ZIP file that contains the deployment bundle. This flow is designed as a fast alternative to manual deployment, reusing configurations that have already been defined externally.
Inside the modal, the user must first define the deployment context by selecting, in a guided way, the Tenant, Account, and Environment where the service will run. Next, the Service Name is required, which defines the name of the service within Axebow (without the .zip extension). This name will be the visible identifier of the service once it is deployed in the Runtime Dashboard.
The modal includes a “DSL Deployment” switch, which allows the user to specify whether the ZIP file uses the Kumori definition language / DSL. This option informs the system how the bundle content should be interpreted and processed during deployment.
At the bottom of the modal, there is a file upload area, which supports both clicking to select a file and drag & drop of the ZIP file. Once all required fields are completed and the file is uploaded, the user can start the deployment using the Deploy CTA or cancel the action by clicking Cancel.
8 Service detail page
8.1 Overview Tab
The Overview tab is the starting point for quickly understanding how a deployed service is running in Axebow.
At the top of the page, users can see where the service is running (Tenant, Account, and Environment), which resources are allocated (CPU, memory, and storage), and which version is currently running. This information helps users quickly orient themselves and confirm that the service is deployed in the correct environment with the expected limits.
Below, the central section provides a real-time view of the service status. From here, users can select which role or container they want to observe, define the time range, and decide whether data should be refreshed automatically or on demand. Based on these filters, key metrics such as uptime, CPU usage, memory consumption, and network traffic are displayed, making it easy to quickly spot issues or unusual behavior.
At the bottom of the page, a summary of the main service component is shown, including the resources assigned to each instance and the number of active replicas. This section helps users understand how the service is scaled and whether the current configuration matches the actual workload needs.
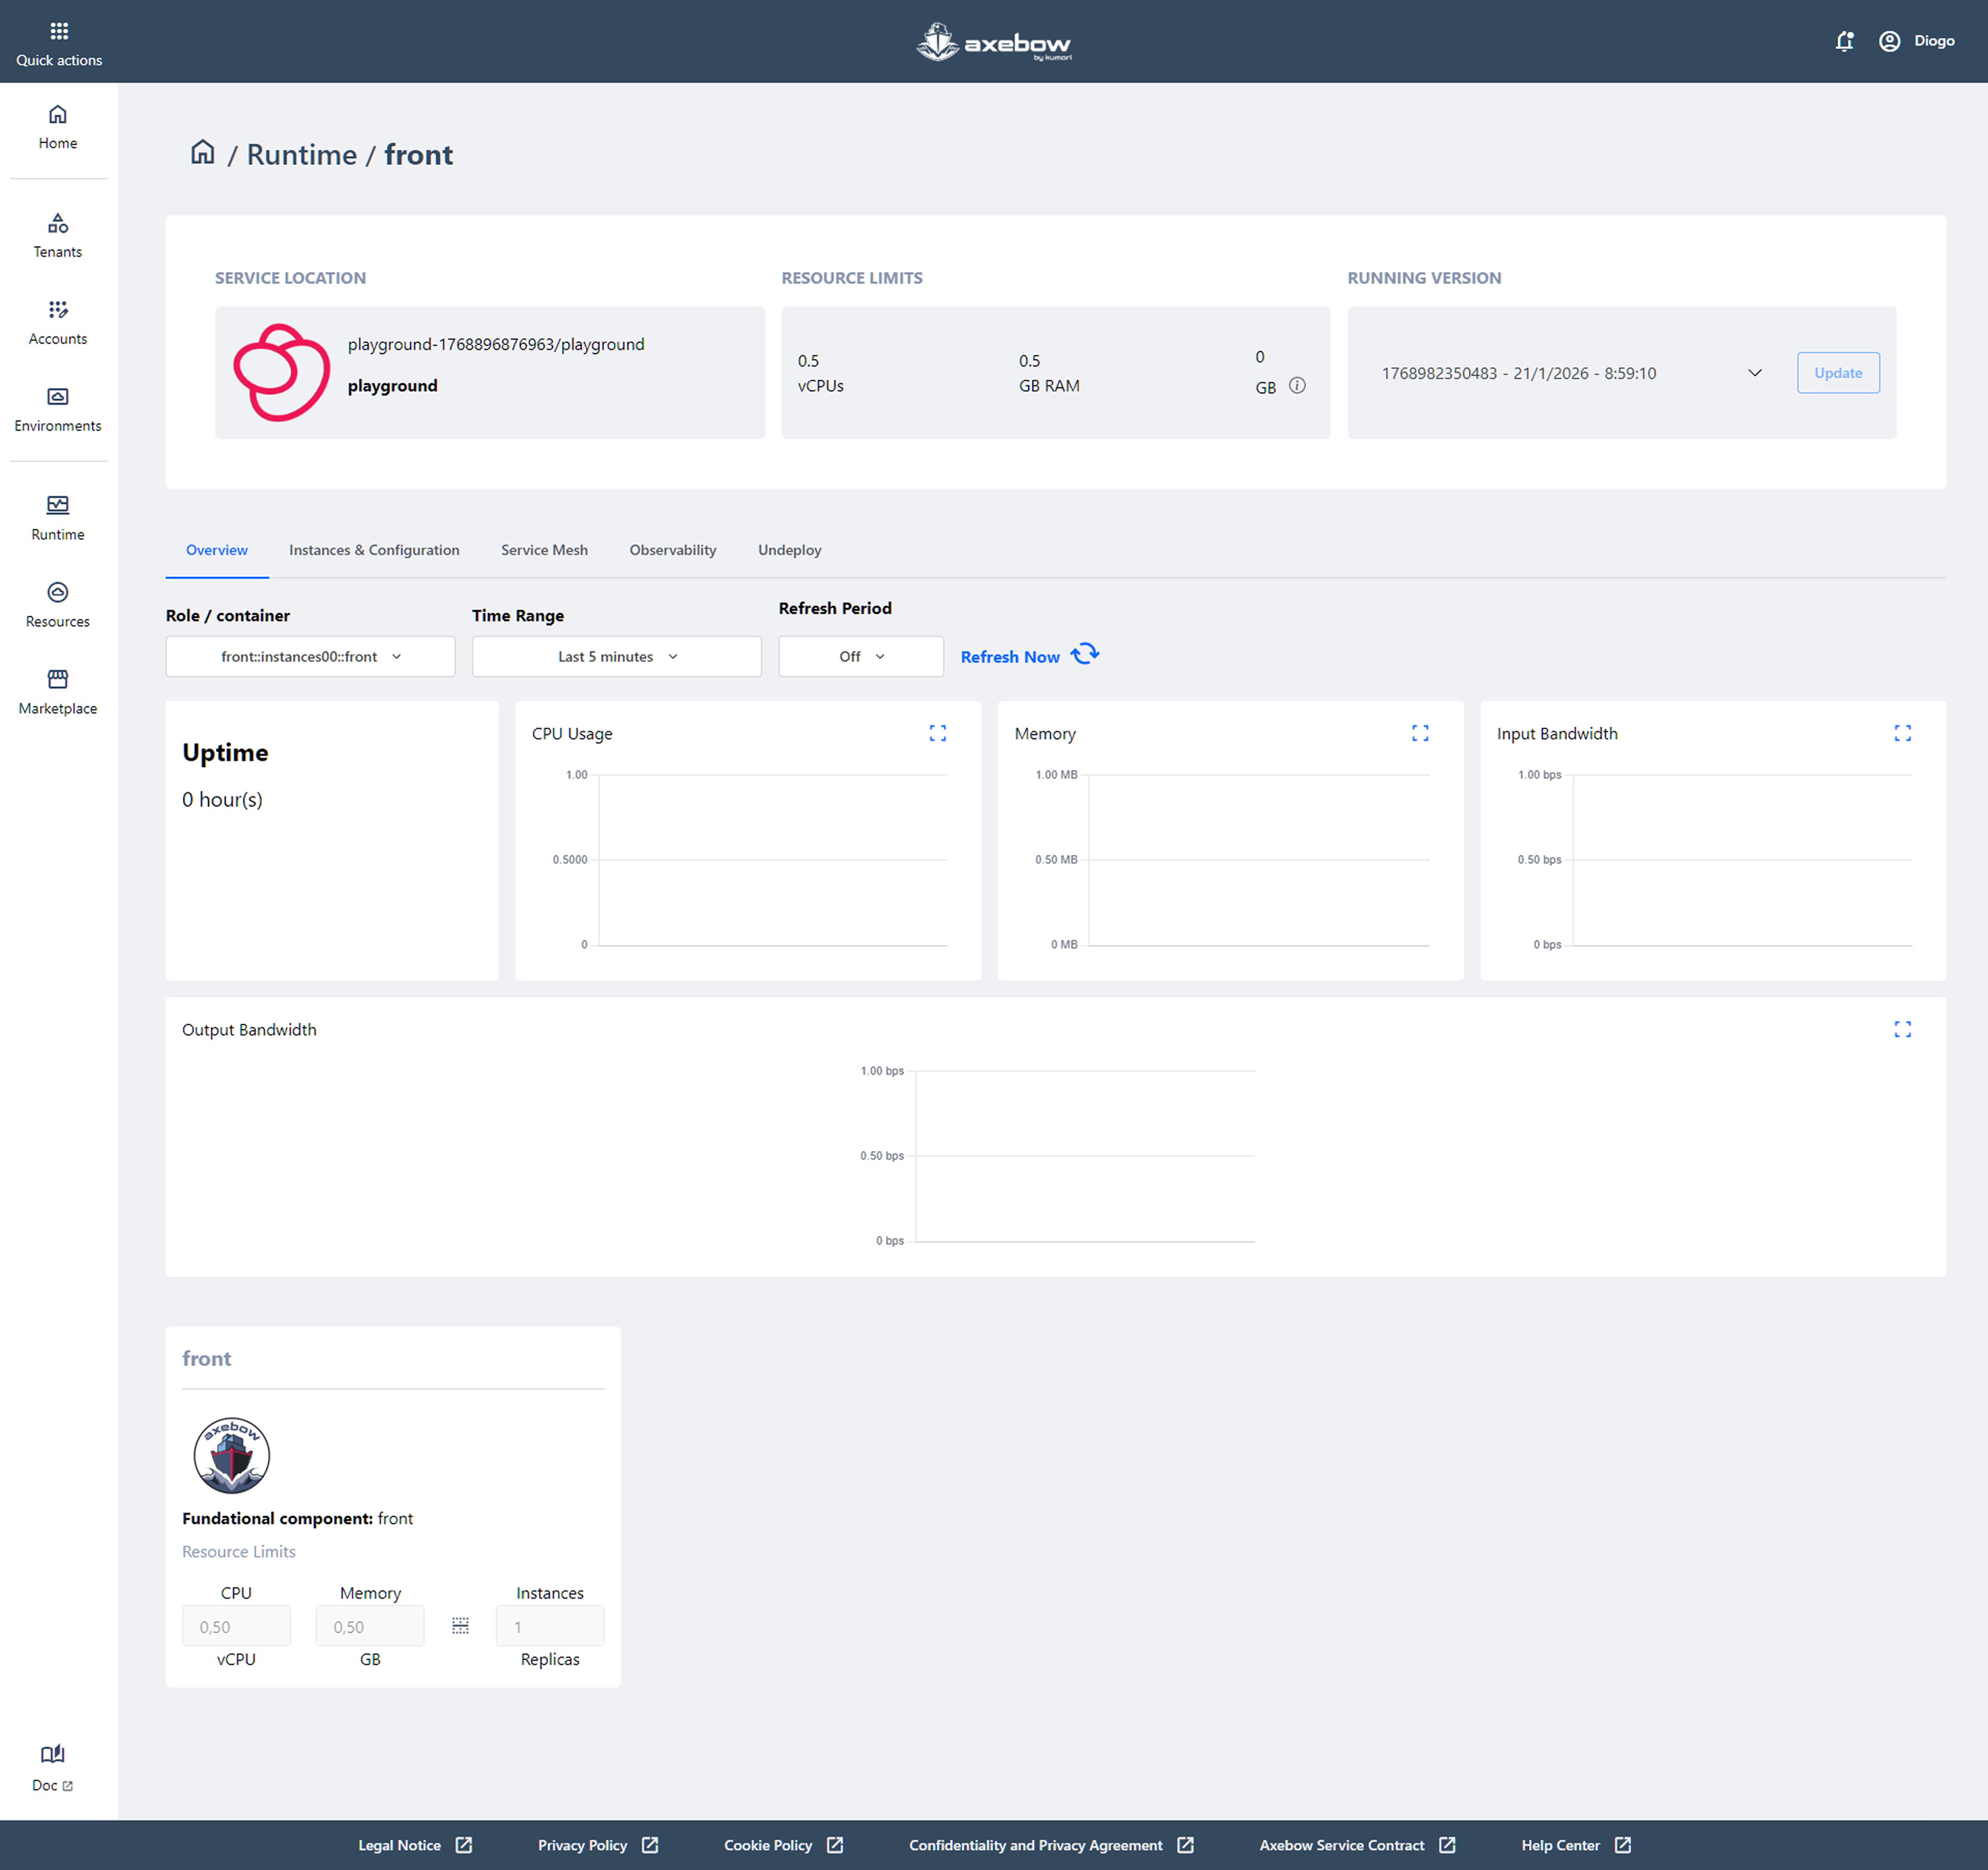
Overall, the Overview tab offers a clear and accessible snapshot of the service state, designed to let users verify at a glance that everything is working as expected before moving on to more advanced actions available in the other tabs.
8.2 Instances & Configuration Tab
: The Instances & Configuration tab allows users to manage the operational behavior of an already deployed service, providing direct control over both its running instances and its active configuration. This view is designed to adjust and monitor the service without needing to redeploy it from scratch.
The page is divided into two main sub-sections:
- Instances
- In this section, users can view all the service instances (containers) in real time. For each instance, the following information is displayed:
Container name
Execution status (for example, Running)
CPU, memory, and storage consumption
Assigned resource limits
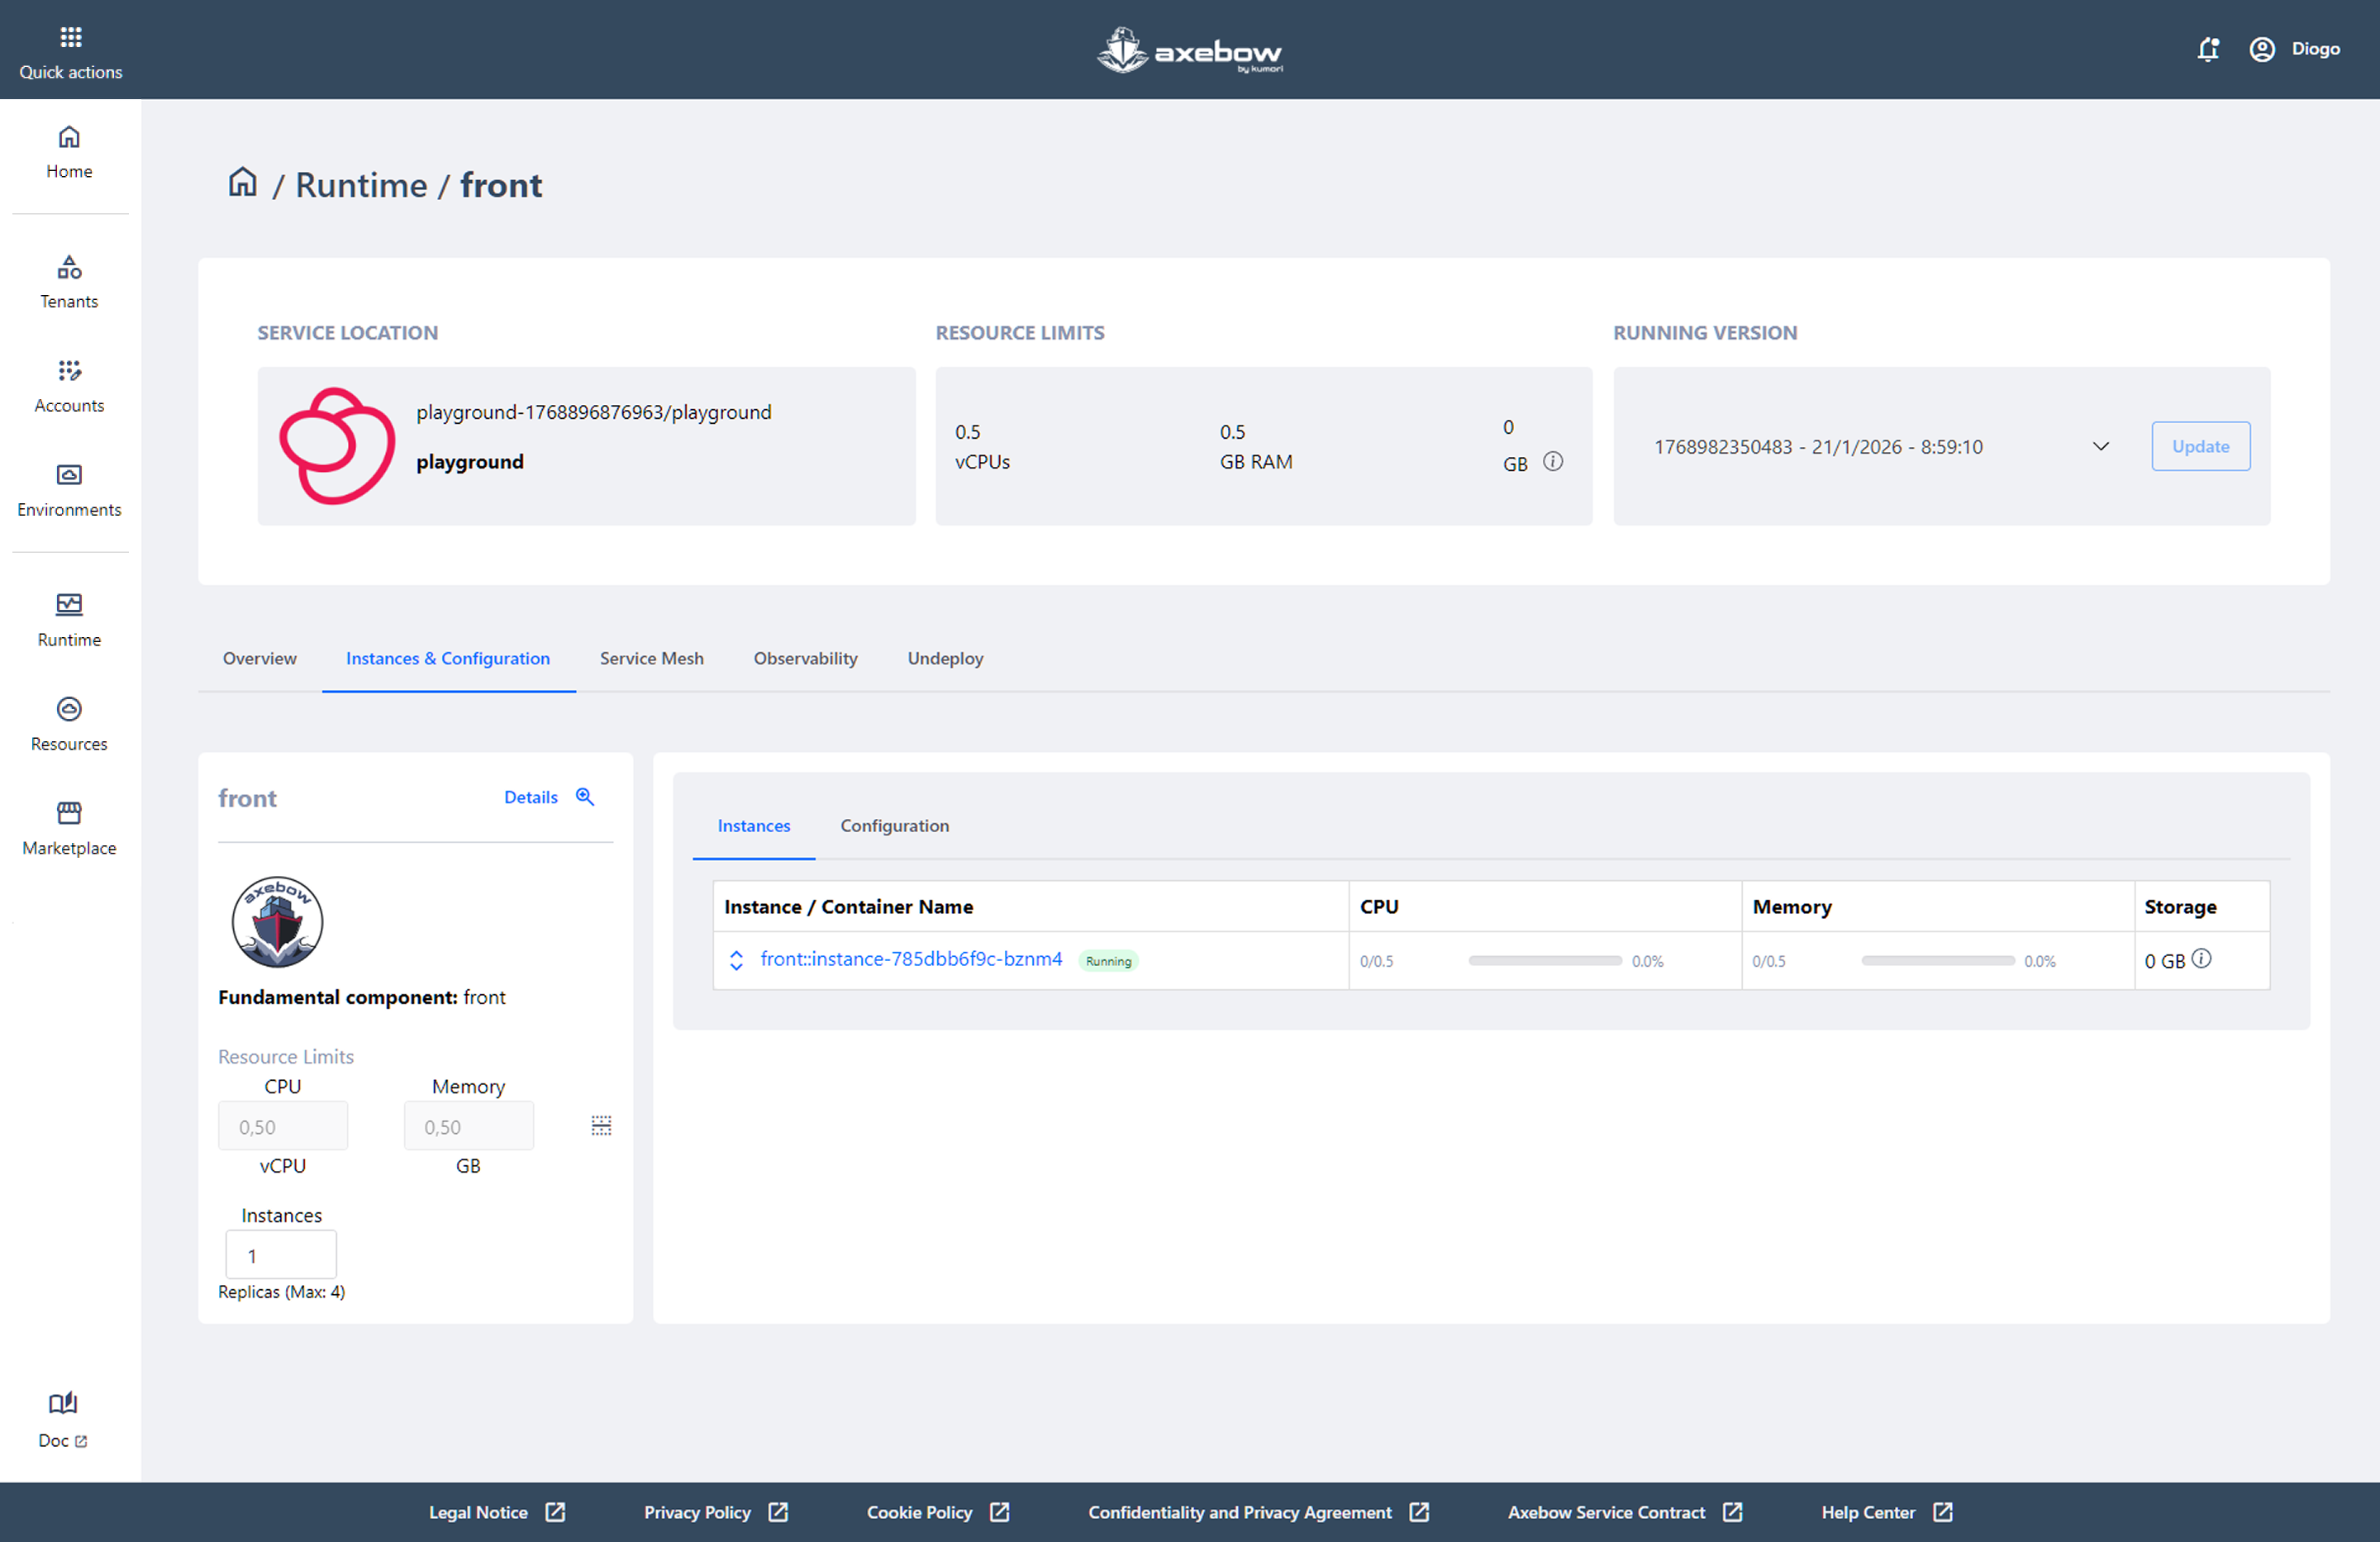
Instances sub-section within the Instances & Configuration main tab From this section, users can:
- Adjust the number of service replicas (within the allowed limits)
- Identify instances with abnormal resource consumption
- Quickly assess whether the service is properly sized
This section is key for scaling, resource optimization, and operational diagnostics.
- Configuration
-
The Configuration sub-section displays the active configuration parameters and values of the service in the runtime environment.
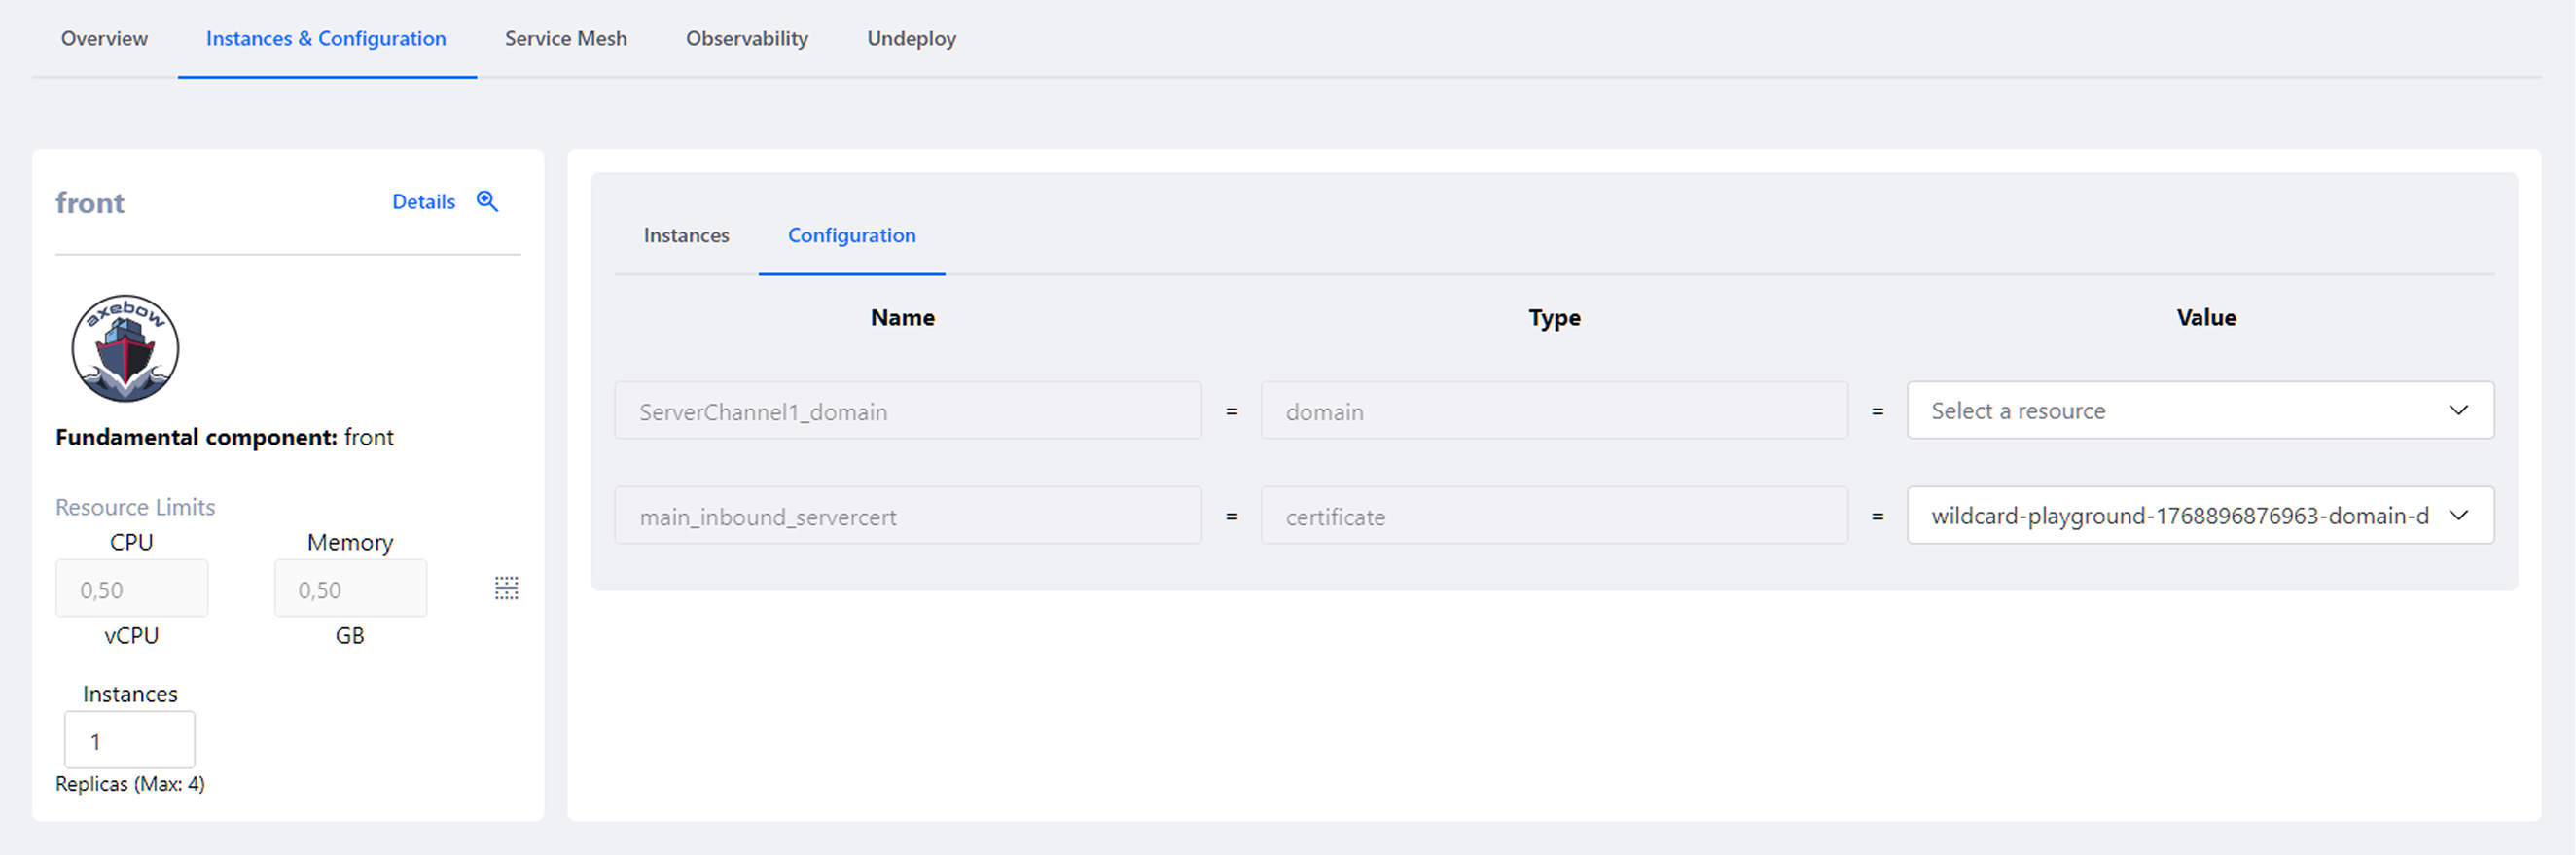
Configuration sub-section for parameters and environment variables within the Instances & Configuration main tab Here, users can:
- View configuration variables associated with channels, domains, certificates, or other resources
- Check which values are currently being used by the service
- Understand how external dependencies are being resolved (for example, domains or certificates associated with a Server Channel)
Depending on the deployment origin and user permissions, this information may be:
- Editable, allowing configuration adjustments and applying changes via a redeploy
- Read-only, when the service originates from a Marketplace template
8.3 Service Mesh Tab
The Service Mesh tab allows users to visualize and manage how a deployed service communicates with other services within the same tenant. This view is designed to work at the operational (runtime) level and focuses exclusively on the actual links between services that are already running.
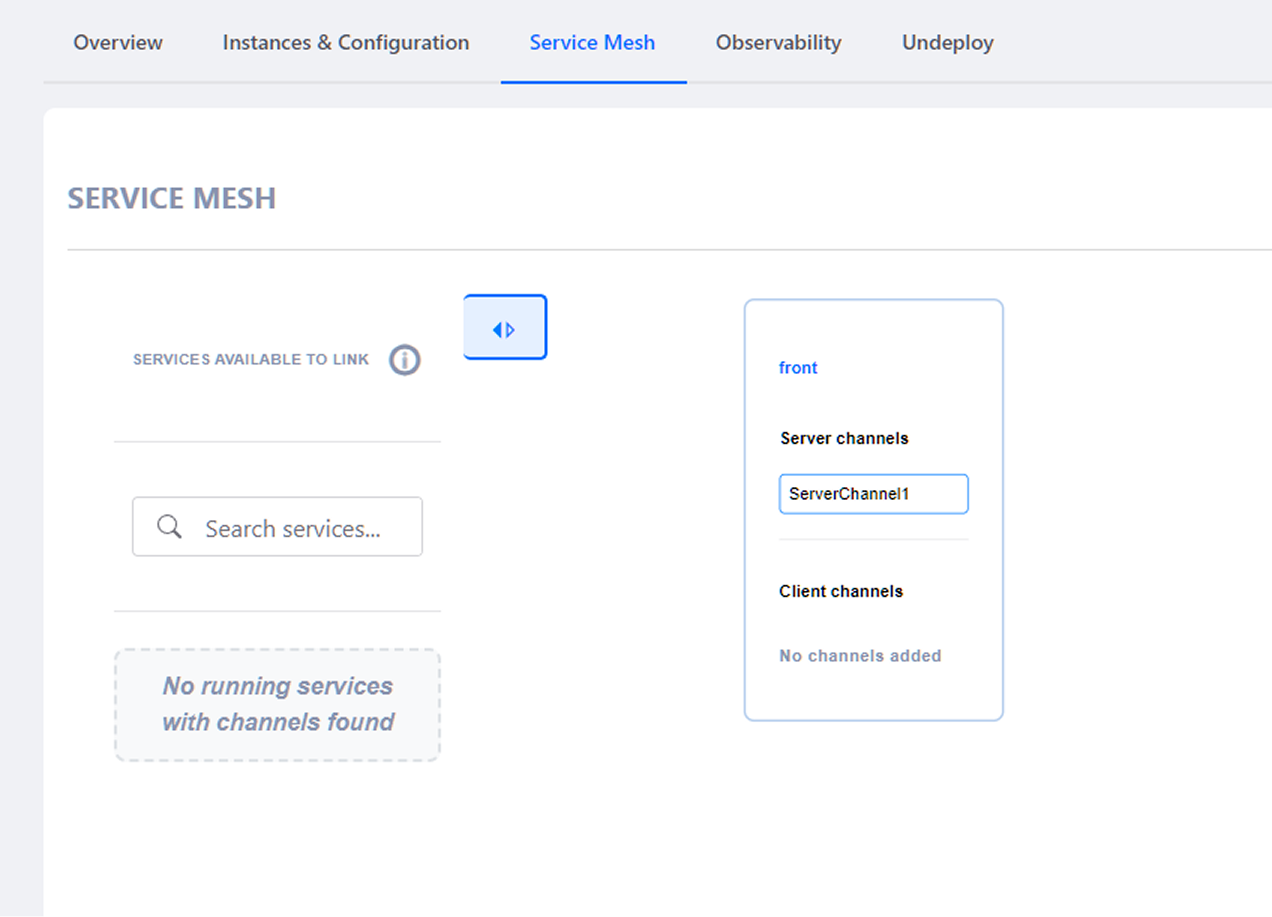
This section provides a drag & drop canvas, where the following elements are displayed:
- Services available to link
- On the left side, a list of deployed services that are available to be linked is shown. From here, users can:
- Search for services using the search field.
- Quickly identify whether there are compatible services available for linking.
- Drag & drop available services into the canvas.
- View informative messages when no services with configured channels are available (for example: “No running services with channels found”).
This panel acts as the starting point for creating new connections between services.
- Current service and its channels
- On the right-hand side, the currently selected service is displayed together with it available channel:
- Server channels: channels through which this service can receive traffic.
- Client channels: channels that allow this service to connect to other services.
Each channel have to be clearly named and visually differentiated, making it easier to understand how the service can send or receive communications. From this view, users can:
- Understand which channels are available for linking.
- Visualize the service’s communication capabilities in a structured way.
- Prepare the creation or review of links with other compatible services.
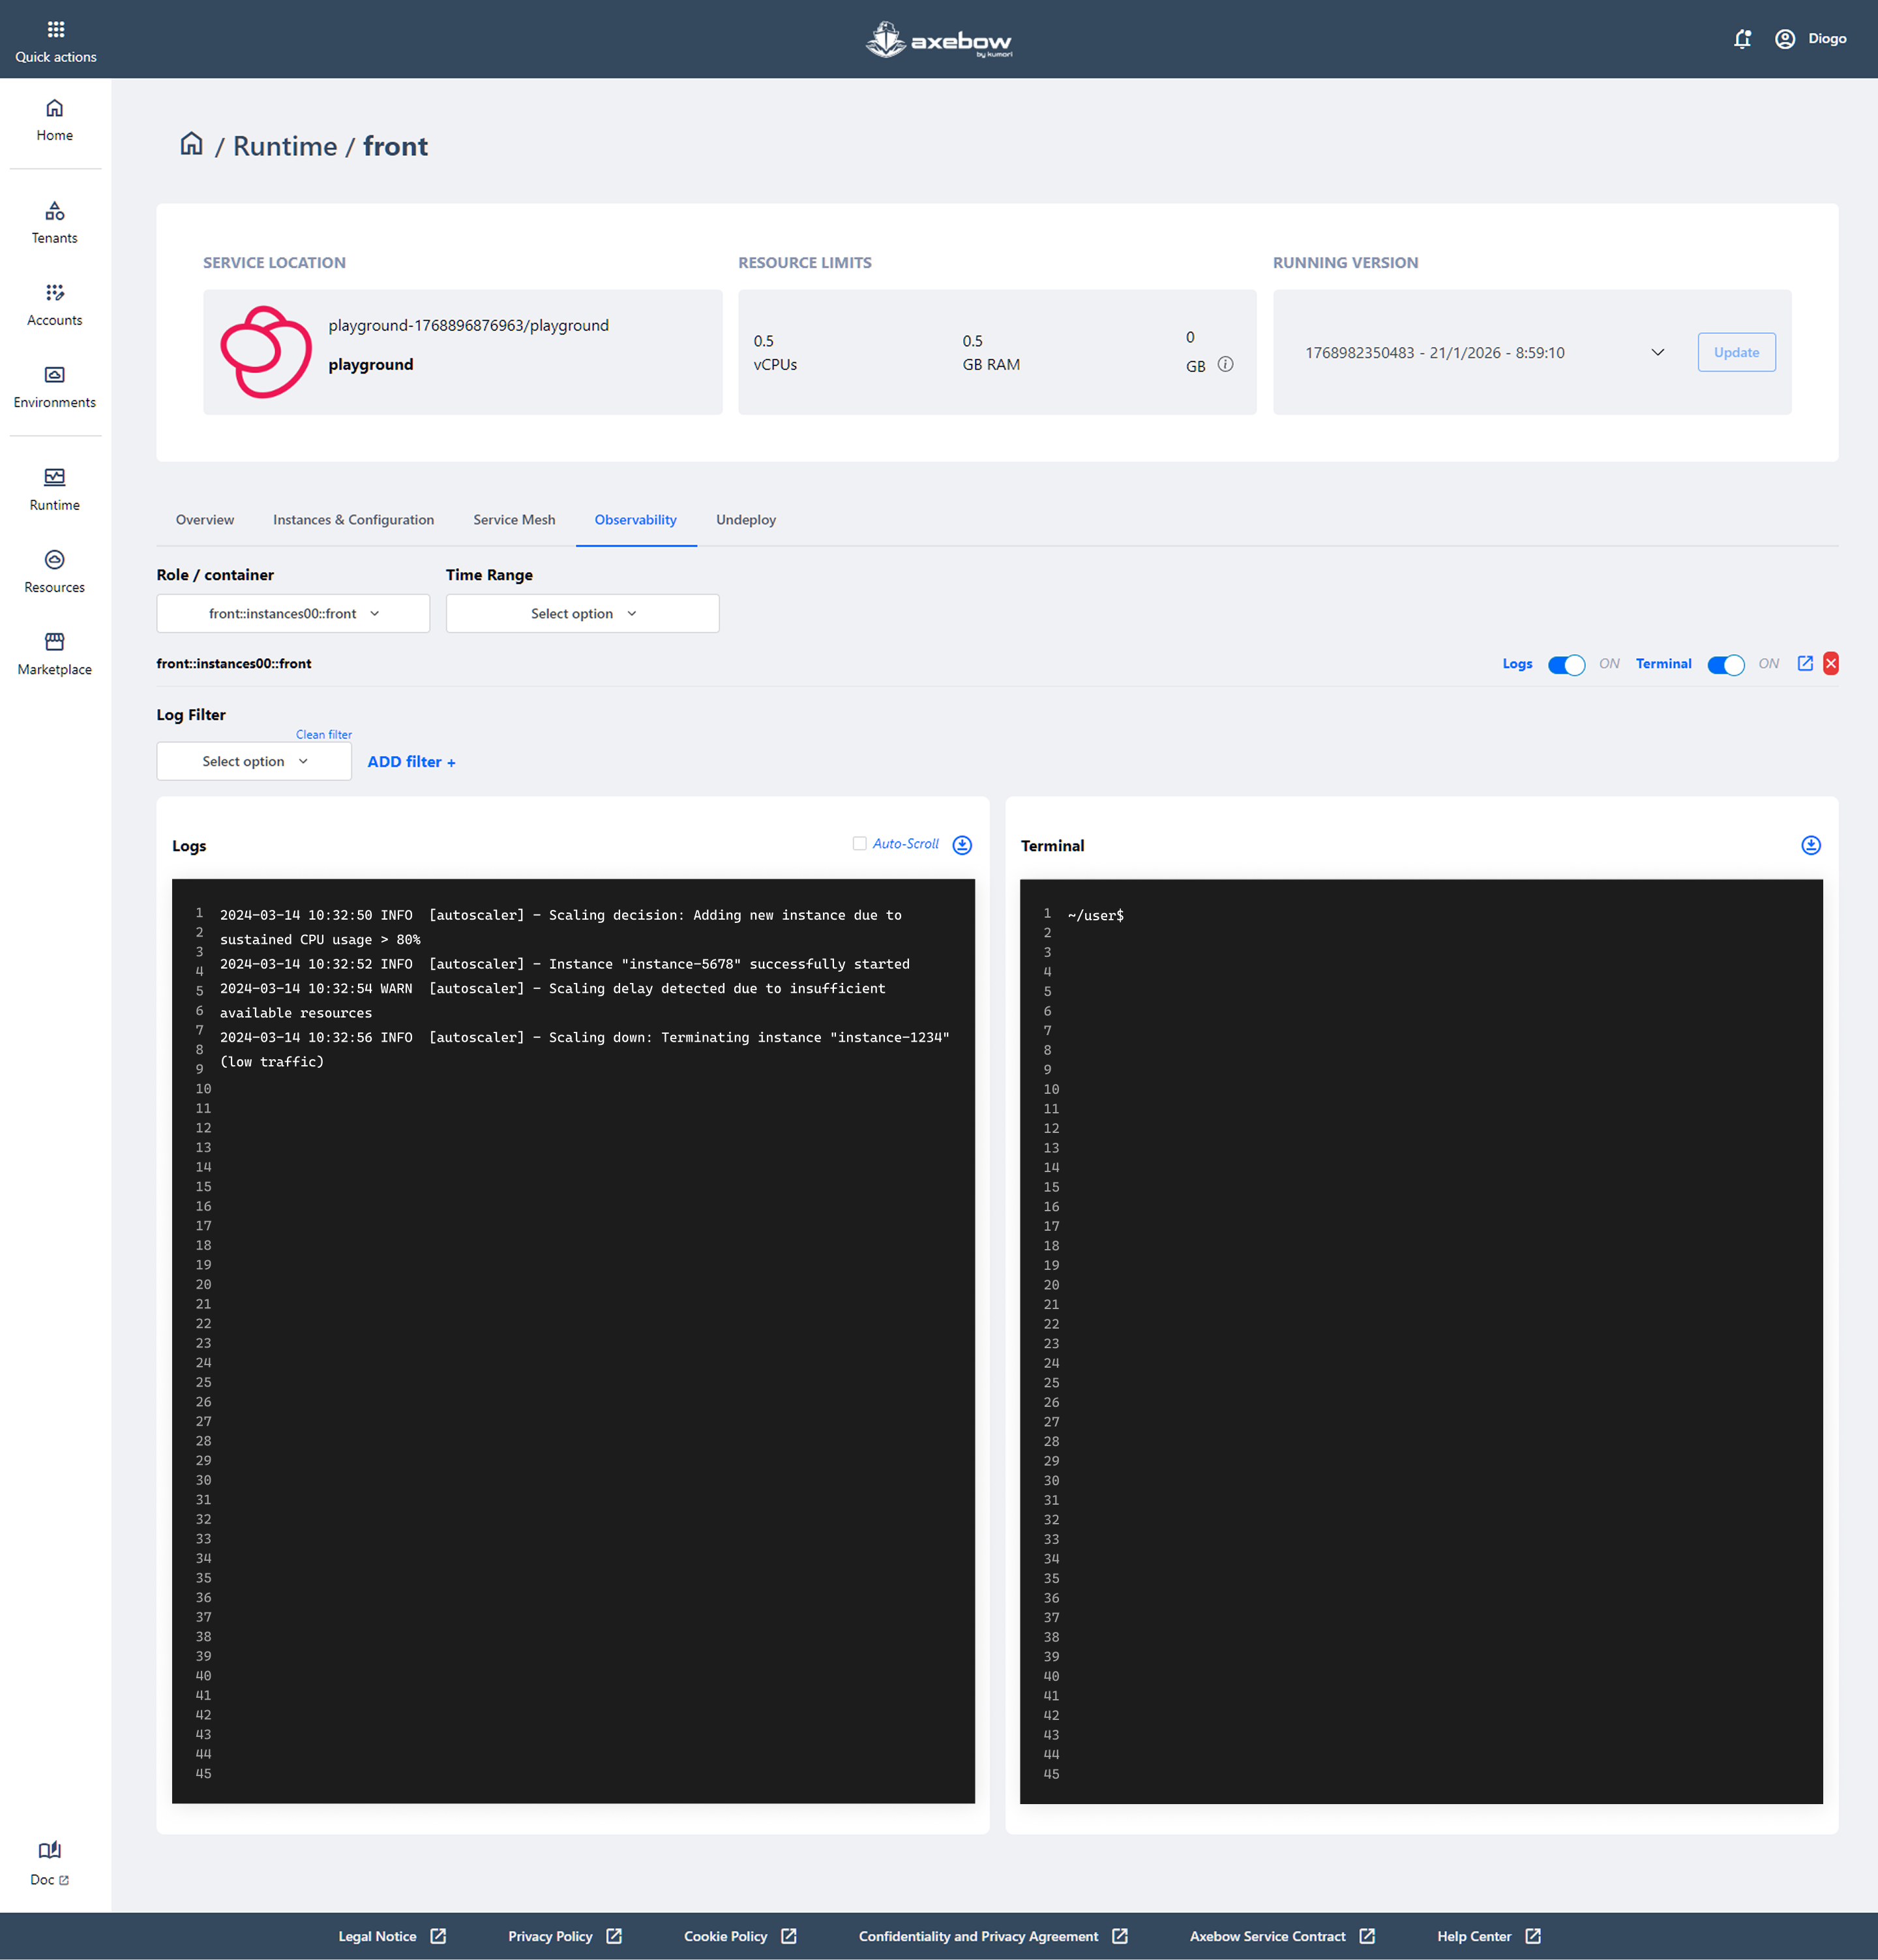
8.4 Observability Tab
The Observability tab allows users to monitor the operational behavior of a deployed service in real time. It is designed to help understand what is happening inside the service, diagnose issues, and validate its correct behavior during execution.
In this view, users can:
- Select the specific role or container they want to observe, which is especially useful when the service has multiple instances.
- Define a time range to narrow down the information displayed and analyze recent or historical events.
- Filter logs using custom criteria, making it easier to find relevant messages or specific errors.
- View service logs in either continuous or static mode, allowing users to follow the service activity in real time or review past events.
- Access an interactive terminal for the selected container, enabling command execution, inspection of the internal service state, and advanced troubleshooting directly from the platform.
Additionally, the interface provides quick controls to enable or disable log and terminal views, as well as auto-scroll options to support real-time monitoring.
Overall, this tab serves as the service’s observation and diagnostics center, providing users with the tools needed to monitor execution, investigate abnormal behavior, and make informed decisions during daily operations.
8.5 Undeploy Tab
The Undeploy tab is the area where the user can stop and permanently remove a deployed service in Axebow. This view is designed for critical actions and therefore includes clear warning messages and explicit confirmation mechanisms to prevent accidental deletions.
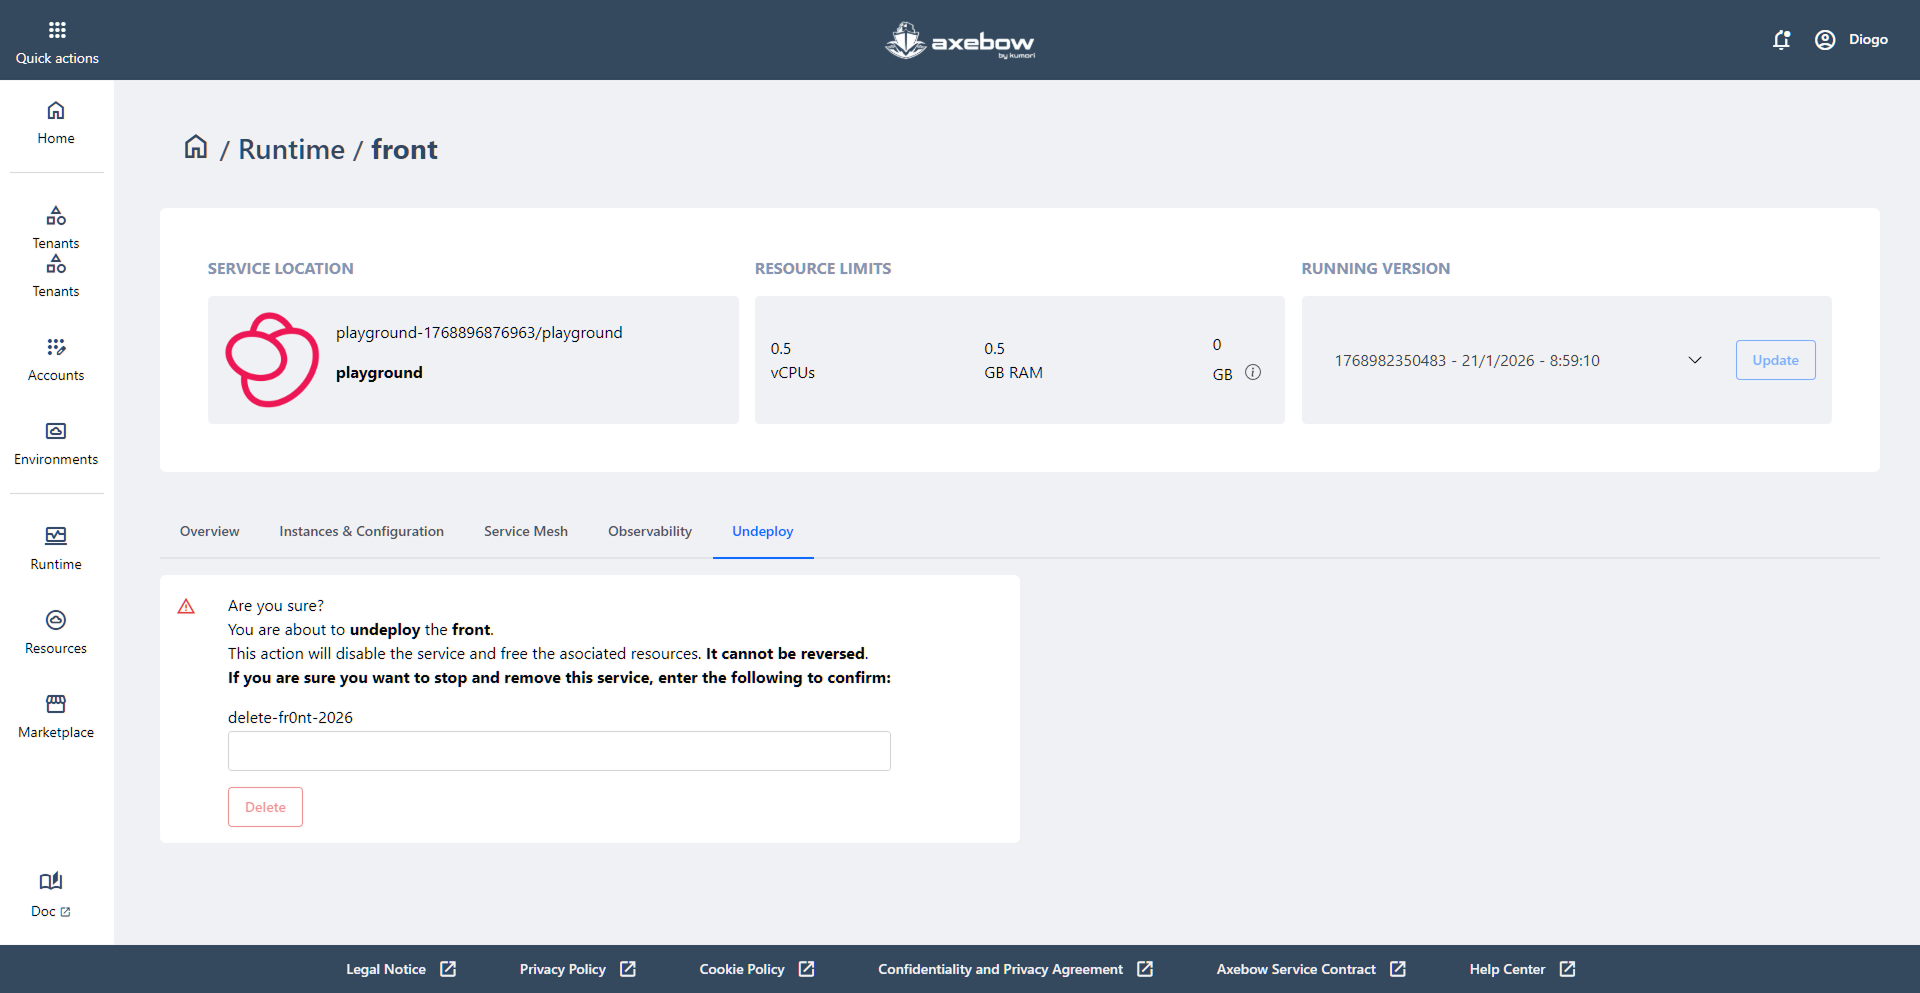
On this page, the user can:
-Clearly understand the action they are about to perform through a visible warning message explaining that the service will be disabled and that the associated resources will be released. - Be aware that this is an irreversible action, as the service cannot be recovered once it has been removed. - Consciously confirm the deletion of the service by manually entering a specific verification text (for example, the service identifier), adding an extra layer of safety. - Execute the final action using the Delete button, which is only enabled once the confirmation text is entered correctly.
This tab acts as a safety zone within the service detail view, ensuring that the removal of a service is always an intentional, informed, and user-controlled decision.
9 Resources dashboard
The Resources Dashboard is the space where users can manage the shared resources used across services deployed in Axebow. This page acts as a central administration point for key elements that can later be reused during service deployment and configuration.
From this view, users can:
- Filter by Tenant, which is especially useful when working with multiple infrastructures or teams.
- Clearly visualize the different types of resources available on the platform, organized into individual cards.
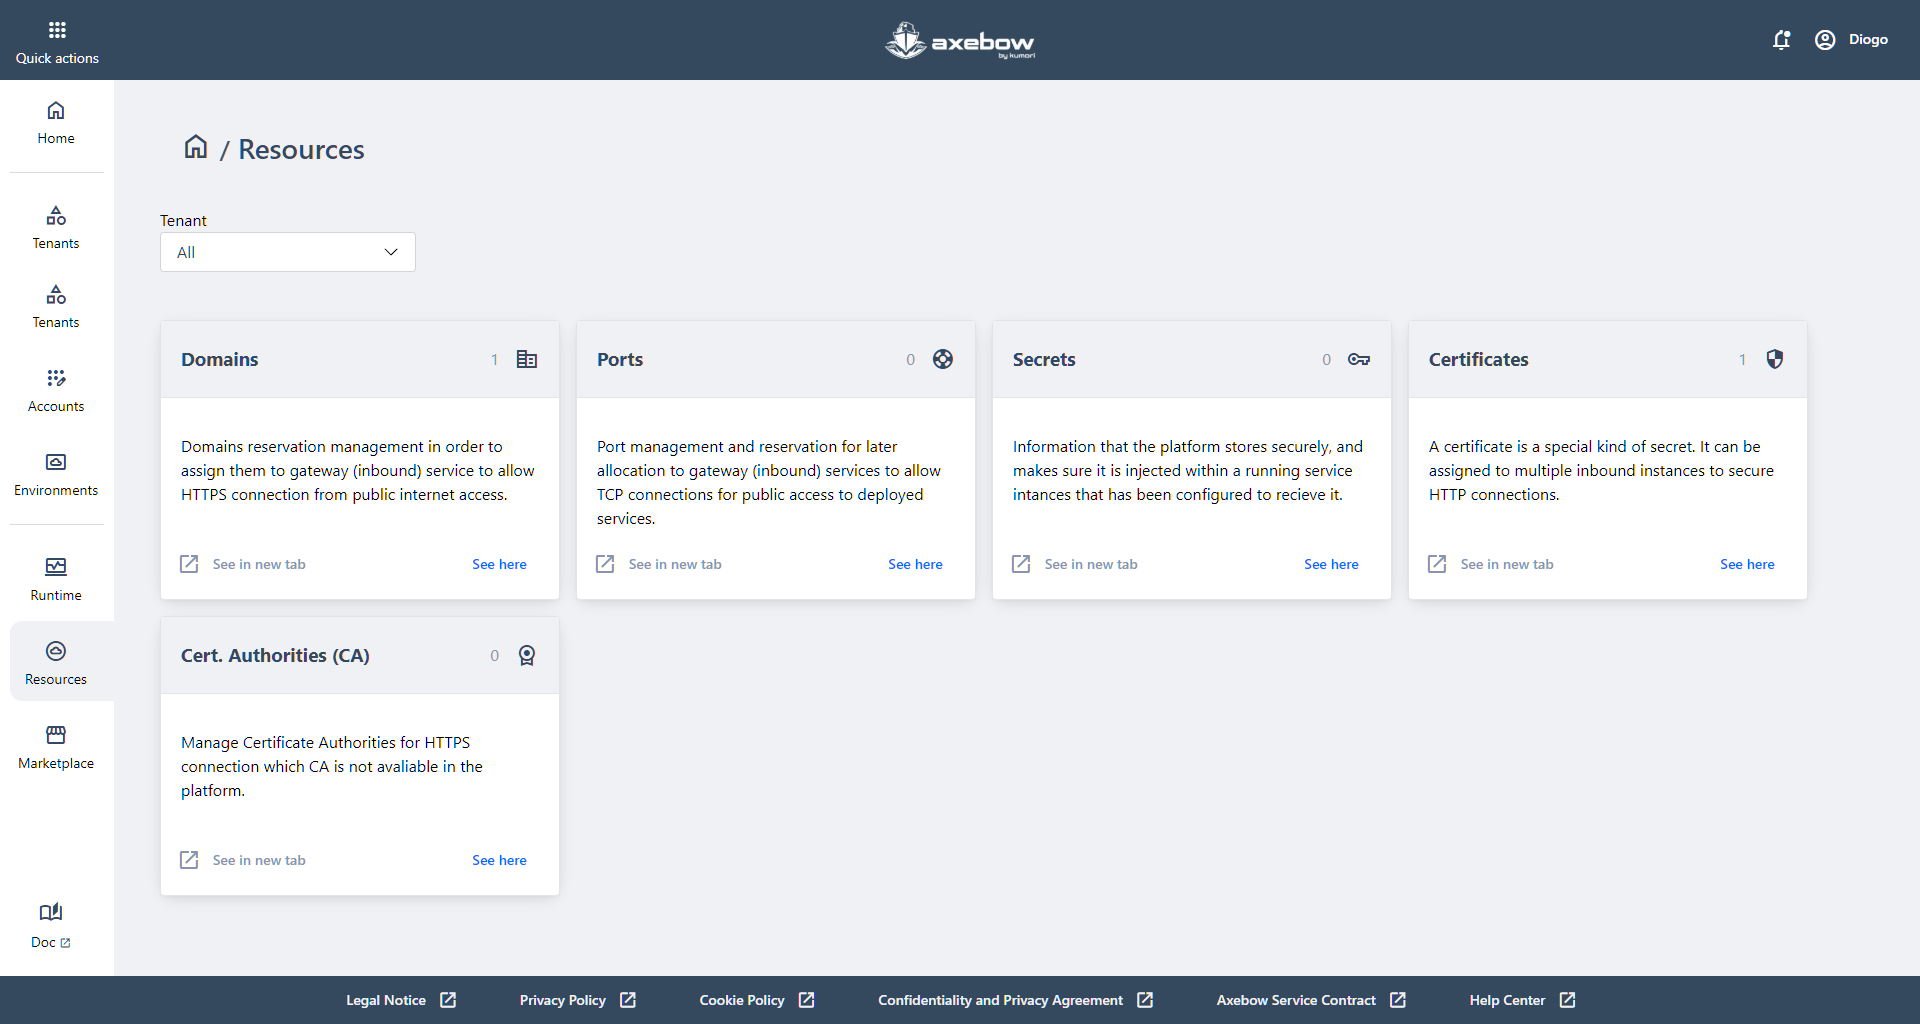
Each card represents a specific type of resource and provides direct access to its management:
- Domains
- Allows users to manage and reserve domains that can be assigned to services exposed to the Internet (for example, through gateways) in order to enable public HTTPS connections.
- Ports
- Enables the management and reservation of ports that can later be used by services with public TCP access.
- Secrets
- Contains sensitive information securely stored by the platform (such as credentials or keys), which can be injected into running services that have been configured to receive it.
- Certificates
- Allows users to manage digital certificates, a special type of secret that can be assigned to one or more services to securely enable HTTPS connections.
- Cert. Authorities (CA)
- Provides the ability to manage external Certificate Authorities in cases where the CA is not directly available on the platform. This facilitates the use of custom or corporate certificates.
Each card includes quick access options to open the resource in a new browser tab or go directly to its detailed view, enabling smooth and efficient navigation between resources and services.
Overall, the Resources Dashboard serves as Axebow’s central repository of shared assets, allowing users to prepare and maintain the elements required for the proper deployment, exposure, and security of their services in an organized and reusable way.